The Australian real estate landscape is a dynamic tapestry, woven with regional nuances and market intricacies that demand a keen understanding. This is a brief analysis of the Australian Bureau of Statistics (ABS) data for five pivotal states: Queensland, New South Wales, Victoria, South Australia, and Western Australia. This data delves into the intricate details of Small Area 2 (SA2) regions, providing invaluable insights into the construction trends of new houses and the associated average building costs.
Navigating the Urban Fabric
Australia’s real estate story unfolds uniquely in each state, shaped by economic drivers, population dynamics, and lifestyle preferences.
This report begins in Queensland, where coastal growth corridors such as Ripley and Caloundra West – Baringa drive approvals upward, while lifestyle destinations like Noosa Hinterland see building costs surge.
Moving south to New South Wales, we uncover a mosaic of contrasting trends, from the booming outer suburbs of Oran Park and Leppington to cost escalations in Maclean – Yamba – Iluka.
In Victoria, regional markets like Shepparton – North and Drouin dominate with rapid growth, while metropolitan precincts such as Balwyn North continue to anchor the premium end.
Further west, South Australia balances suburban expansion in Munno Para West – Angle Vale with lifestyle appeal in Victor Harbor, and Western Australia showcases dual momentum, strong outer-Perth activity alongside regional cost rises in Busselton and Margaret River.
Decoding Market Dynamics
The FY25 ABS data reveals a nation marked by contrasts, approvals are rebounding in many growth corridors, while building costs climb sharply in premium and coastal regions.
In New South Wales, outer Sydney remains a powerhouse of approvals, whereas Victoria’s regional centres lead the state’s resurgence.
Queensland continues to expand across both its metropolitan and coastal belts, while South Australia and Western Australia blend suburban growth with regional resilience.
Collectively, the five states underscore Australia’s housing duality, affordability-driven expansion on the fringes and high-value construction in lifestyle-driven and urban precincts.
Strategic Insights for OpenLot.com.au
Armed with this wealth of information, OpenLot.com.au encourages partners and stakeholders to make informed, strategic decisions in navigating Australia’s evolving real estate environment. This analysis not only provides a snapshot of construction and cost trends, but also serves as a compass for future development.
From capitalising on growth corridors like Tarneit, Ripley, and Oran Park to understanding premium pockets such as Balwyn North, Henley Beach, and Nedlands, OpenLot.com.au can tailor its offerings, strengthen community engagement, and continue leading in the digital real estate space.

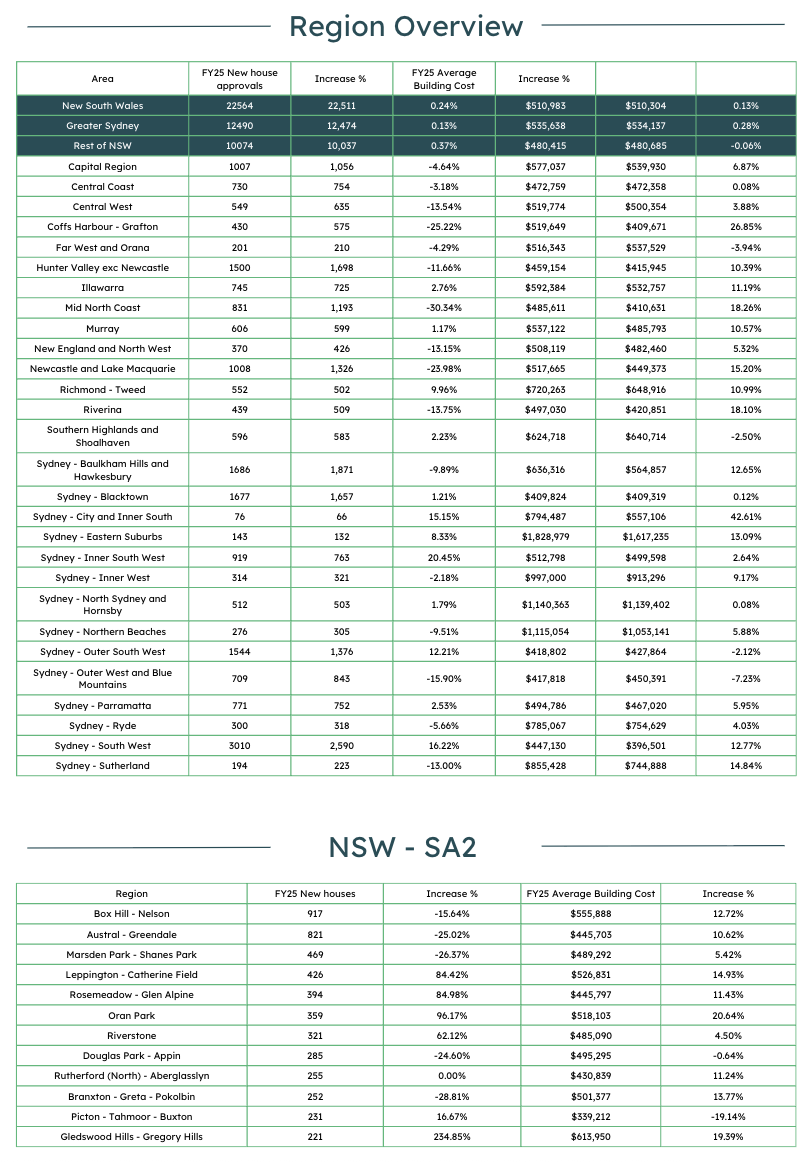
This report delves into the housing data for New South Wales, focusing on Small Area 2 (SA2) regions. The data encompasses the number of new houses and the average building cost in each SA2 area.
Key Findings
New House Approvals:
FY25 approvals across NSW recorded mixed outcomes. Oran Park rose by 96.17% to 359 approvals, while Leppington – Catherine Field grew 84.42% to 426, and Rosemeadow – Glen Alpine increased 84.98% to 394. However, Austral – Greendale declined 25.02%, and Maclean – Yamba – Iluka dropped 65.71%, reflecting an uneven recovery.
Average Building Costs:
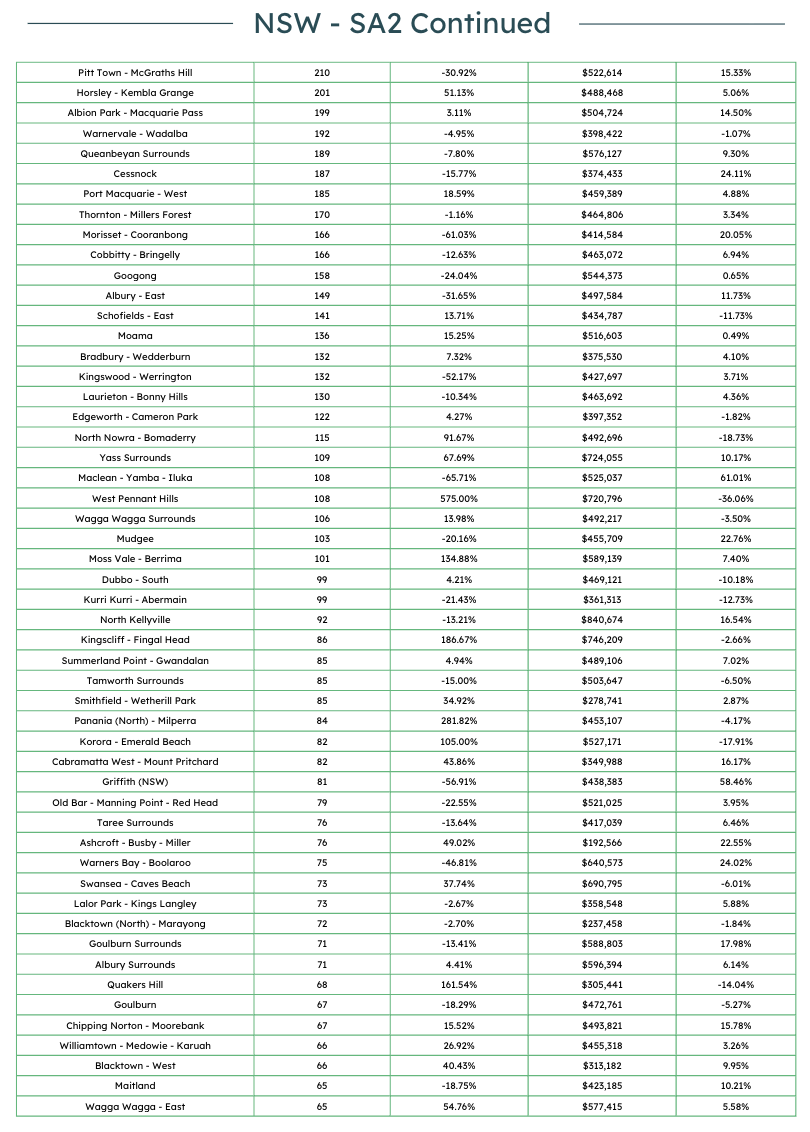
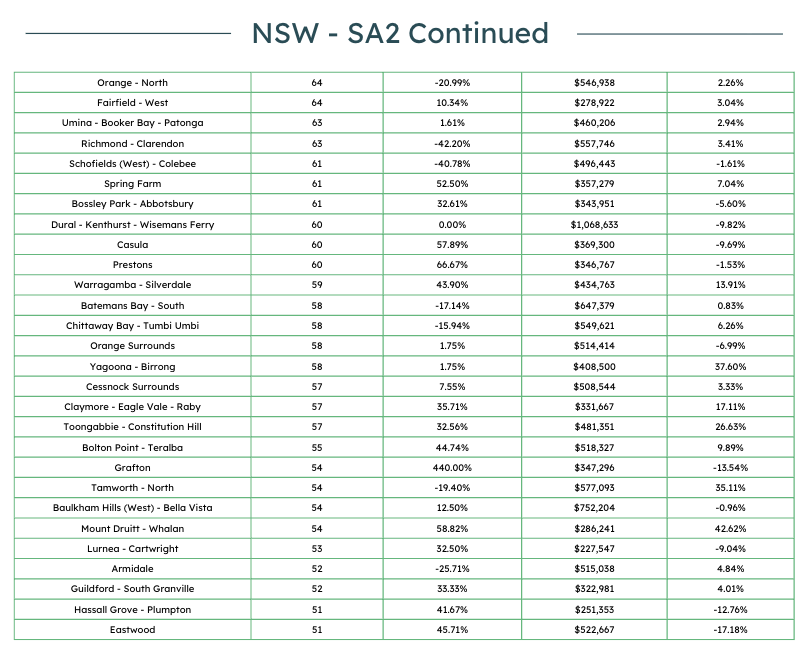
The average building cost across the state rose slightly to $510,983. Some regions recorded significant increases, including Maclean – Yamba – Iluka, which rose by 61.01% to $525,037, and Tamworth – North, which climbed 35.11% to $577,093. North Kellyville reached $840,674 after a 16.54% rise, while Dural – Kenthurst – Wisemans Ferry remained at $1,068,633 despite a 9.82% decline.
Notable SA2 Regions:
Growth hotspots include Oran Park, Leppington – Catherine Field, and Rosemeadow – Glen Alpine. Regional centres like Yass Surrounds also posted strong cost increases.
High-cost zones such as North Kellyville and West Pennant Hills maintain strong demand despite rising construction prices.
High-Increase Areas:
Strongest approval gains were seen in Gledswood Hills – Gregory Hills (+234.85%), Riverstone (+62.12%), and Oran Park (+96.17%), reflecting continued appetite in outer Sydney corridors.
Areas with Notable Cost Increases:
Maclean – Yamba – Iluka (+61.01%), Cessnock (+24.11%), and Warners Bay – Boolaroo (+24.02%) highlight regional escalation in construction costs.

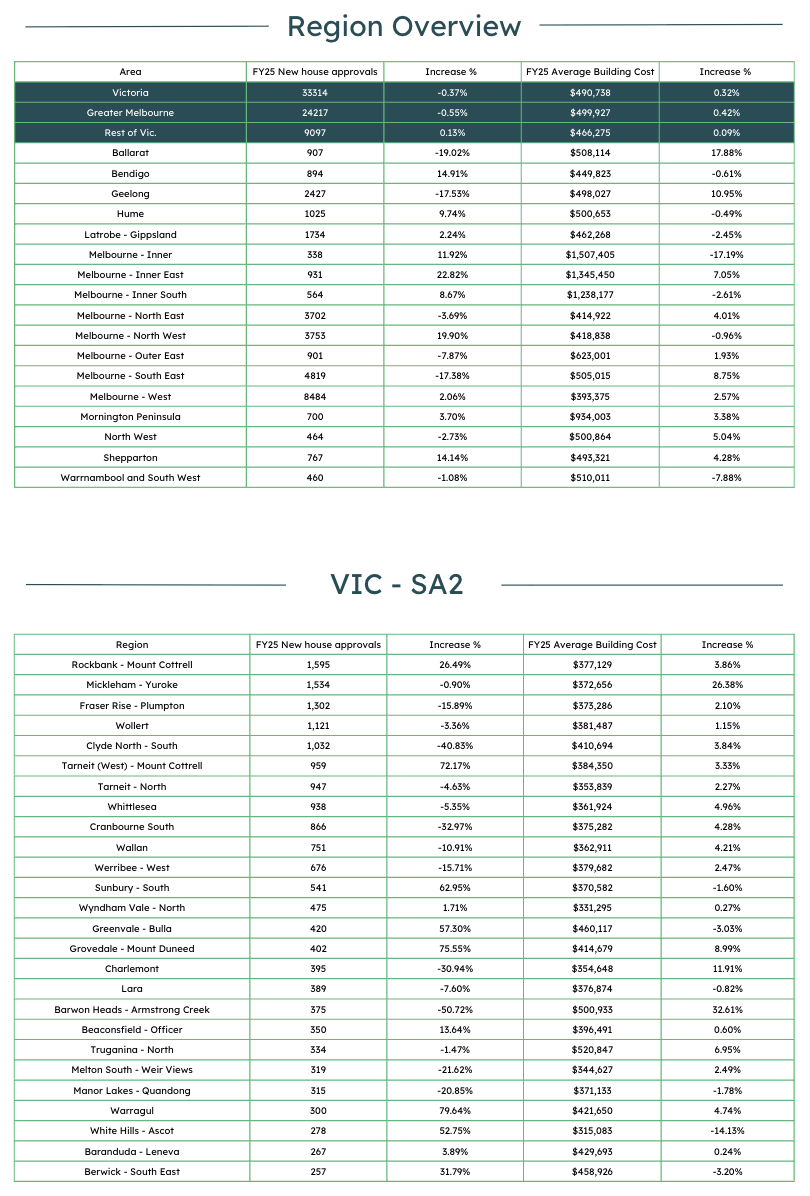
This report delves into the housing data for Victoria, focusing on SA2 regions.
Key Findings
New House Approvals:
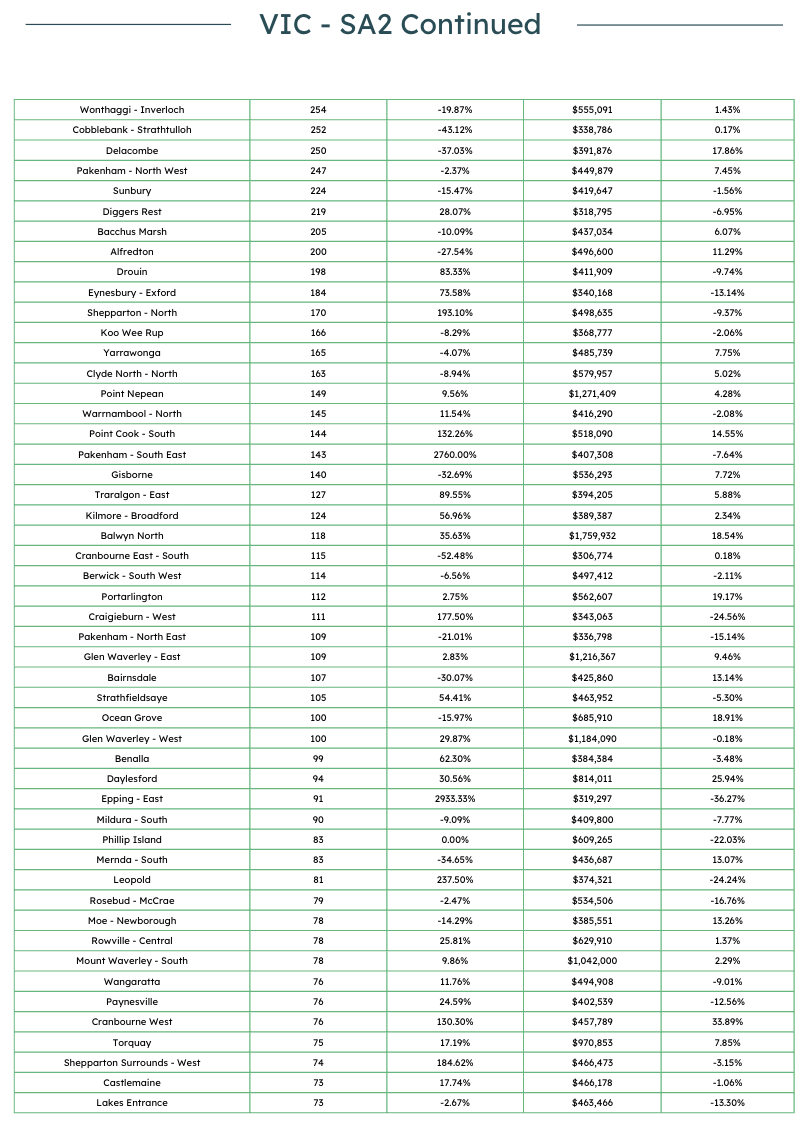
Victoria recorded 33,314 approvals, remaining broadly stable year on year. Regional markets led growth, Shepparton – North rose 193.10%, Drouin increased 83.33%, and Warragul climbed 79.64%.
Metropolitan centres showed mixed results, with Rockbank – Mount Cottrell (+26.49%) and Tarneit (West) – Mount Cottrell (+72.17%) offsetting steep declines in Clyde North – South (-40.83%).
Average Building Costs:
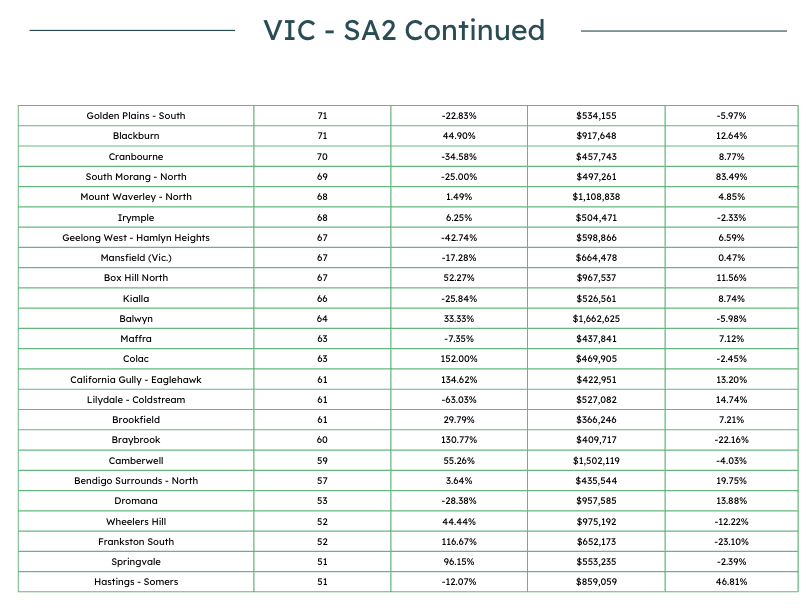
The average building cost across the state rose to $490,738, with significant increases in Daylesford (+25.94% to $814,011), Ocean Grove (+18.91% to $685,910), and Balwyn North (+18.54% to $1,759,932). Premium suburbs such as Camberwell ($1,502,119) and Glen Waverley – East ($1,216,367) remain among the most expensive in the state.

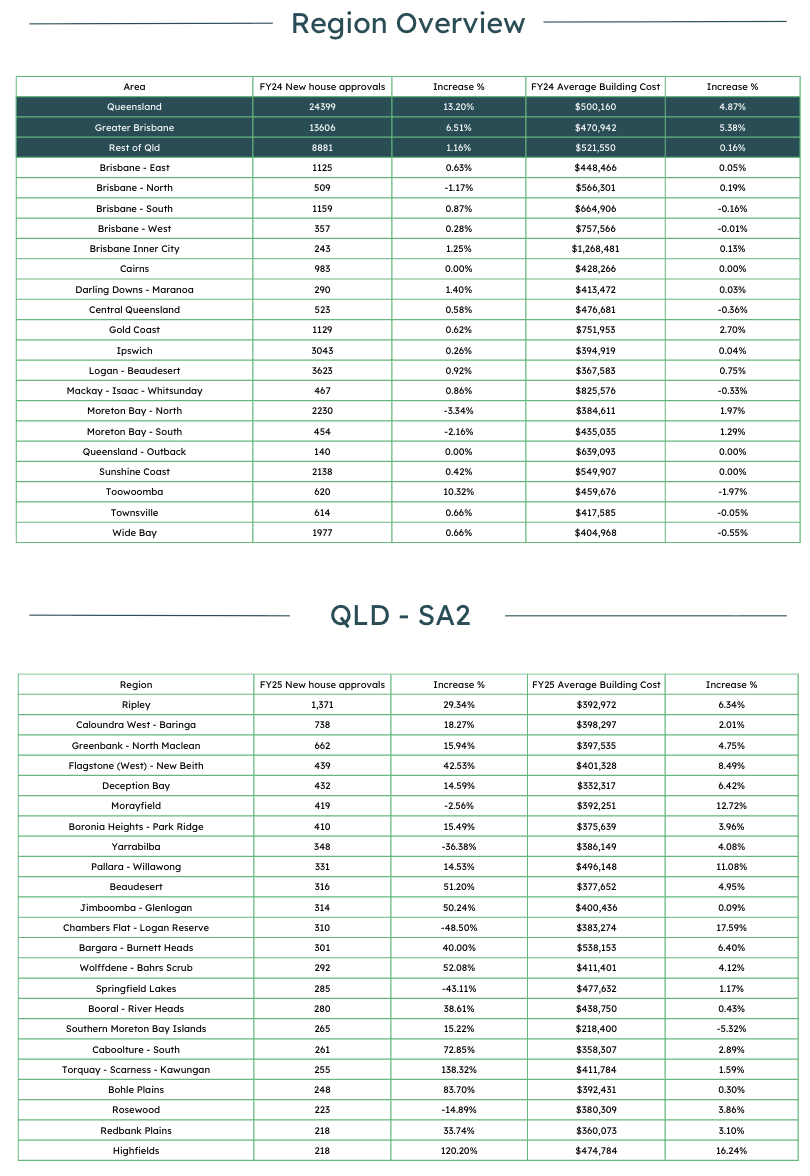
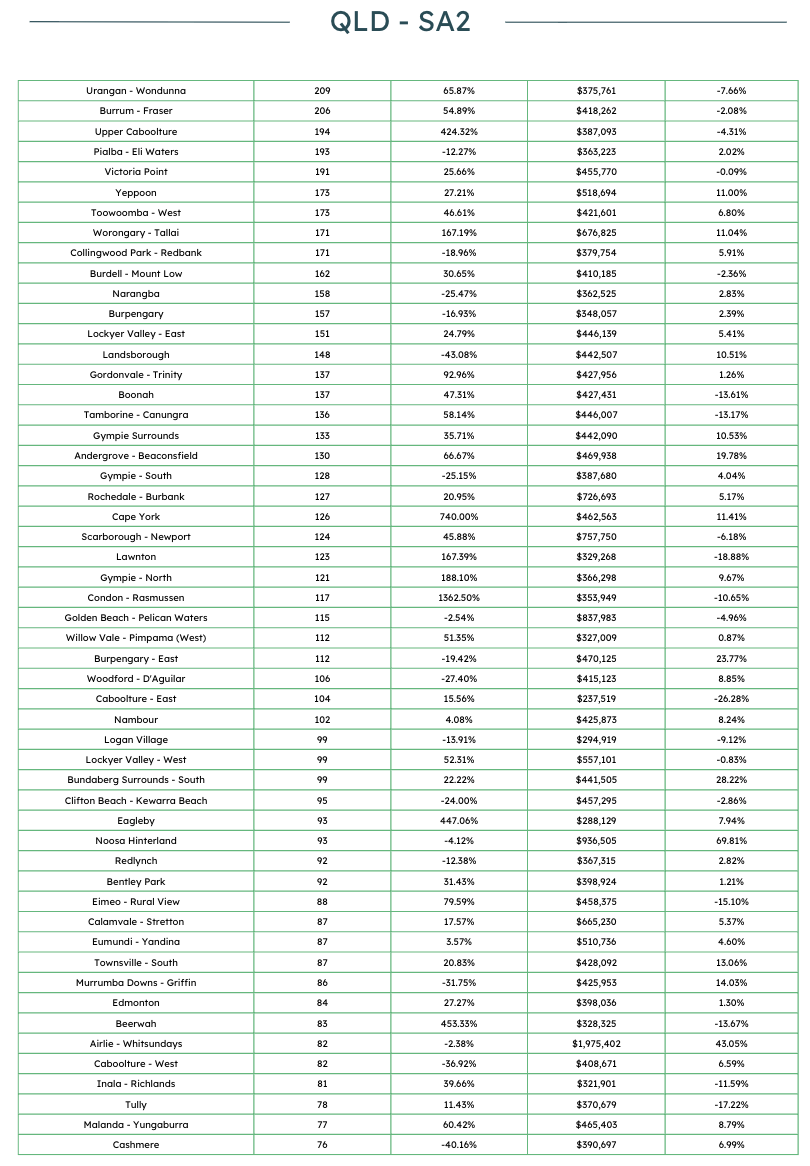
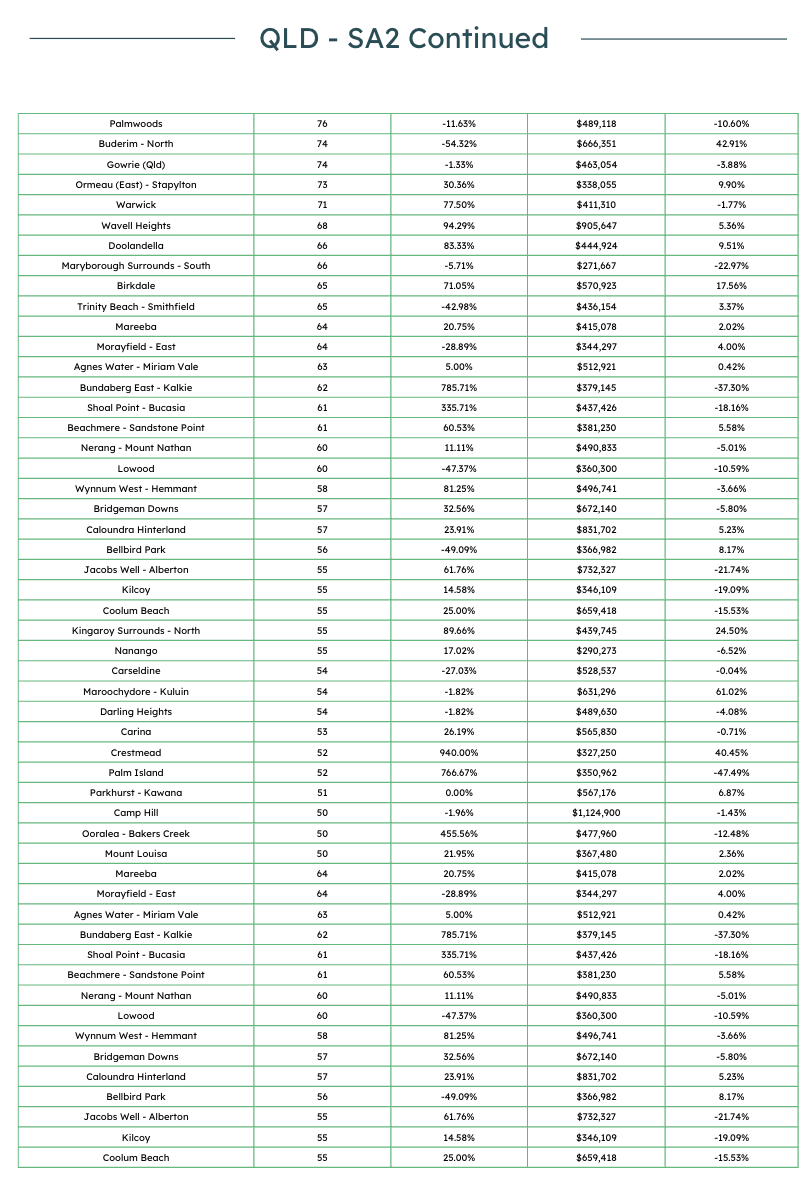
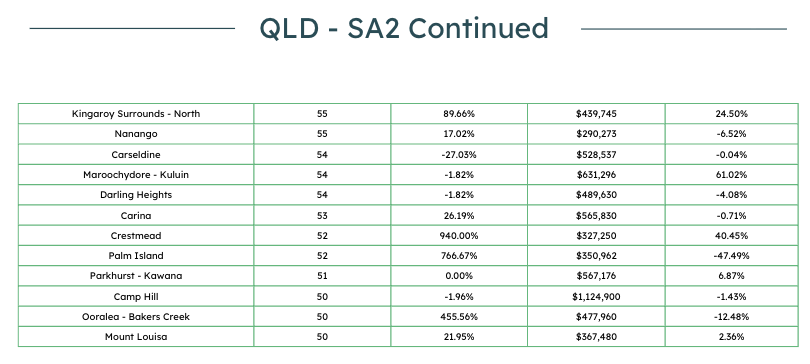
This report delves into Queensland’s SA2 data for FY25.
Key Findings
New House Approvals:
Approvals rose strongly in key hubs, Ripley (+29.34% to 1,371), Caloundra West – Baringa (+18.27%), and Beaudesert (+51.20%).
Remarkable surges occurred in Condon – Rasmussen (+1,362.5%) and Upper Caboolture (+424.32%).
Conversely, Springfield Lakes and Yarrabilba contracted by over 35%.
Average Building Costs:
The average building cost across Queensland rose to $500,160 (+4.87%). Noosa Hinterland saw a sharp 69.81% increase to $936,505, Maroochydore – Kuluin rose 61.02% to $631,296, and Airlie – Whitsundays reached $1,975,402 after a 43.05% rise.

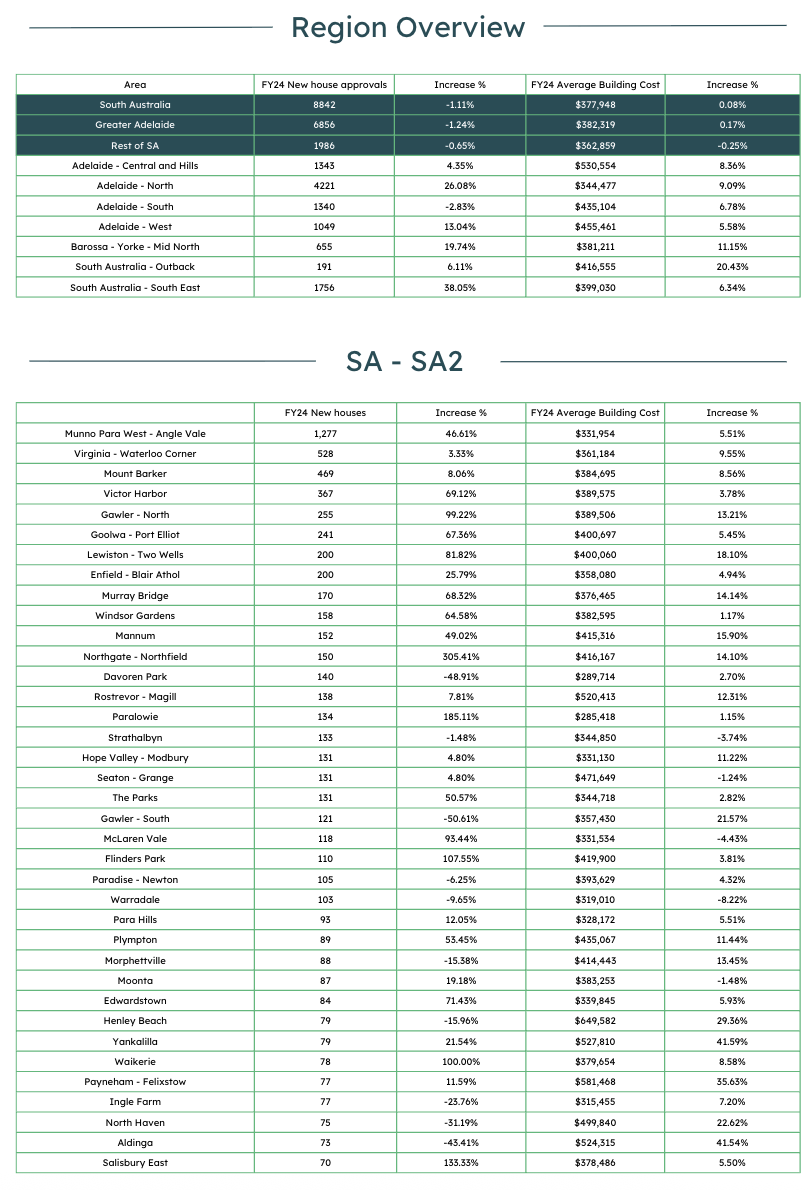
This report explores South Australia’s SA2-level housing data.
Key Findings
New House Approvals:
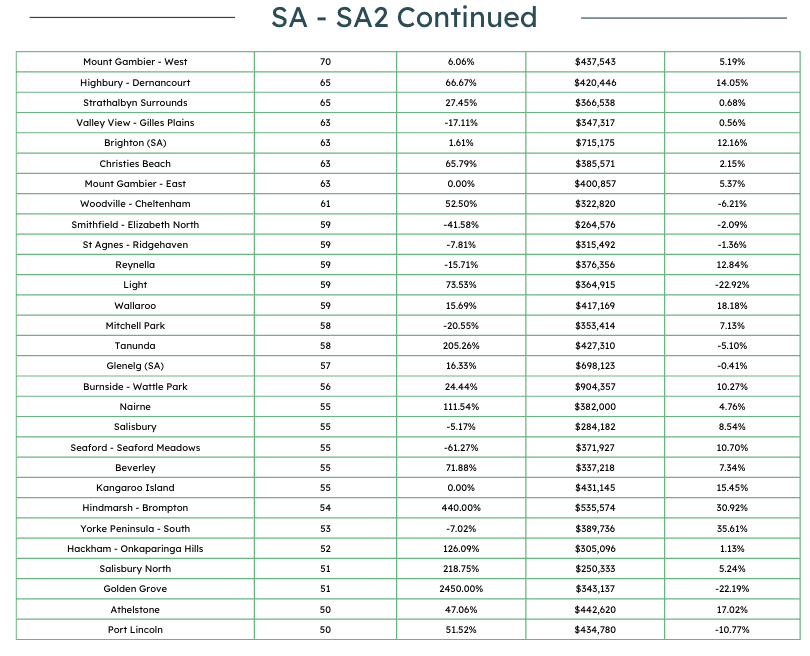
Munno Para West – Angle Vale led with 1,277 approvals (+46.61%), while Victor Harbor and Goolwa – Port Elliot rose by 69.12% and 67.36% respectively.
Urban areas such as Golden Grove (+2,450%) and Northgate – Northfield (+305.41%) posted striking increases, though some regions like Davoren Park declined sharply (-48.91%).
Average Building Costs:
The average building cost rose slightly to $377,948. Yankalilla recorded the steepest increase (+41.59% to $527,810), followed by Payneham – Felixstow (+35.63% to $581,468) and Henley Beach (+29.36% to $649,582).

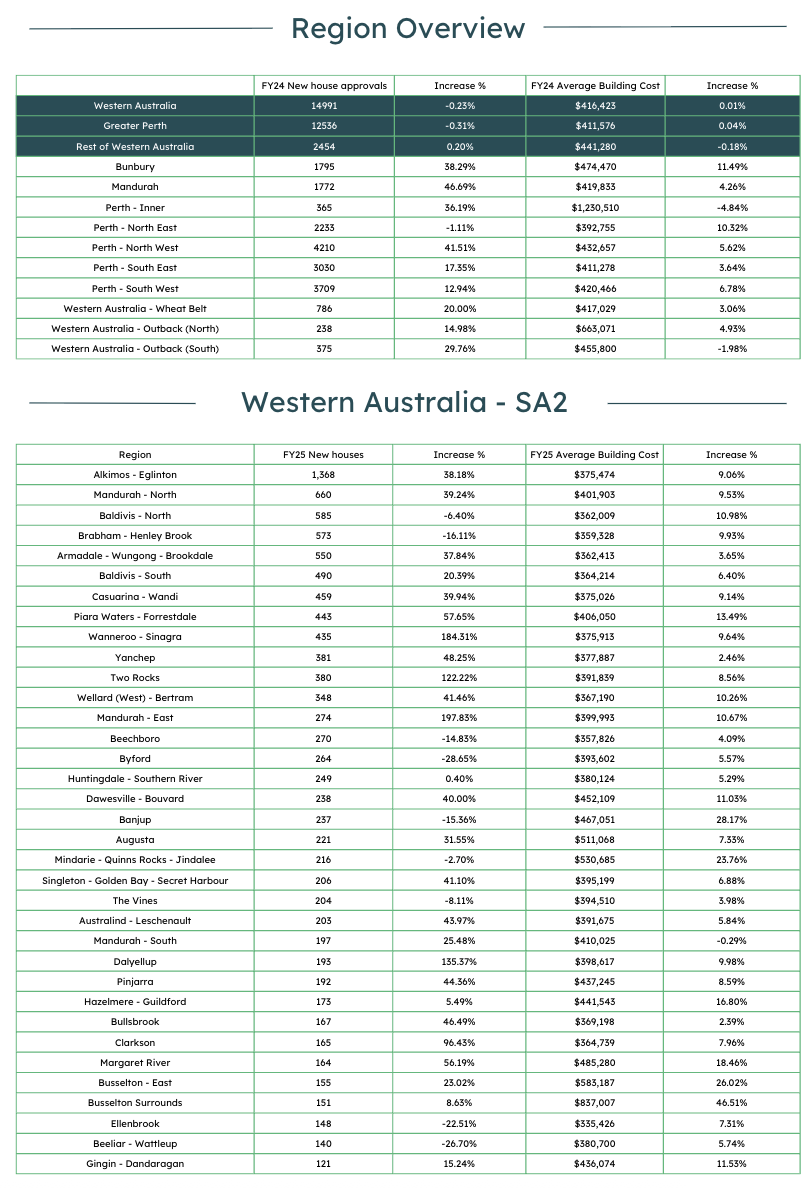
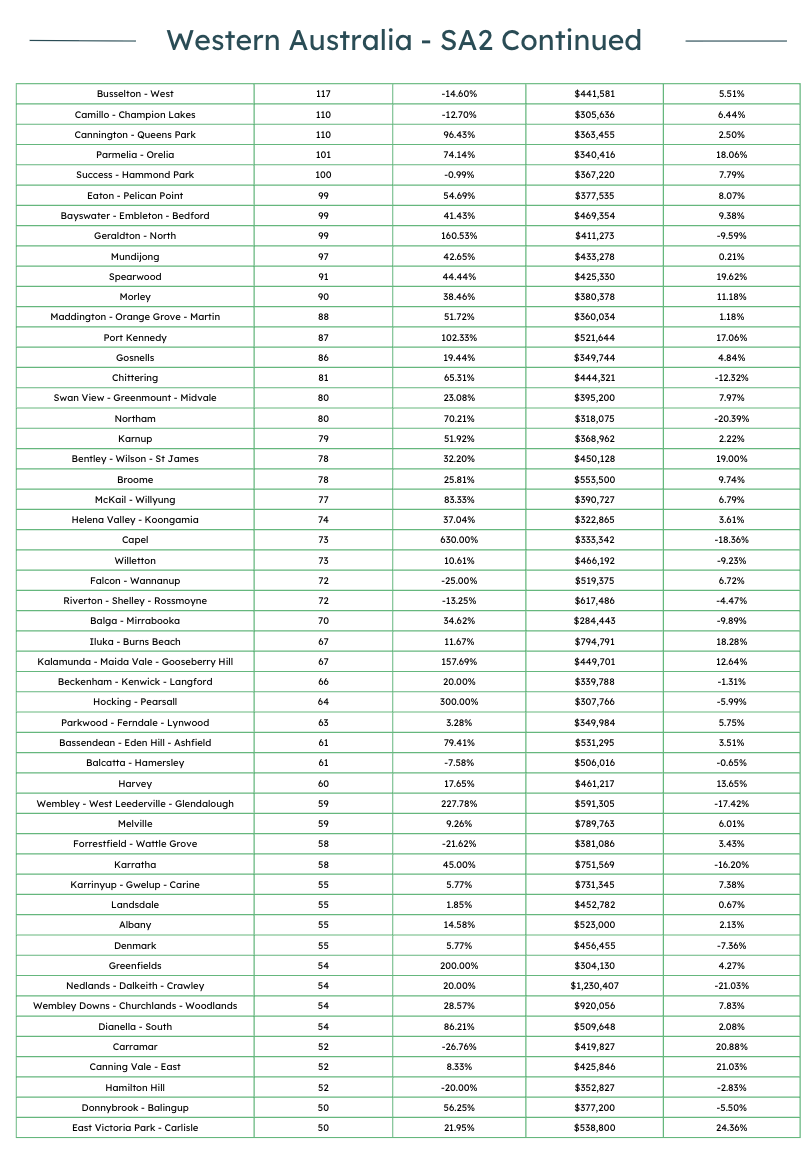
This report examines housing data for Western Australia’s SA2 regions.
Key Findings
New House Approvals:
Alkimos – Eglinton topped the state with 1,368 approvals (+38.18%), followed by Mandurah – North (+39.24%) and Two Rocks (+122.22%).
Significant increases were also noted in Mandurah – East (+197.83%) and Wanneroo – Sinagra (+184.31%).
Average Building Costs:
The average building cost rose slightly to $416,423, with notable increases in Busselton Surrounds (+46.51% to $837,007), Busselton – East (+26.02% to $583,187), and Margaret River (+18.46% to $485,280). Premium suburbs such as Nedlands – Dalkeith – Crawley ($1,230,407) and Wembley Downs – Churchlands – Woodlands ($920,056) remain among the state’s most expensive.
Conclusion
The comprehensive analysis of ABS data for FY2025 unveils a vivid portrait of Australia’s housing dynamics. Each state reflects a unique balance of opportunity and pressure, from Queensland’s coastal growth to Victoria’s regional revival and Western Australia’s suburban surge. OpenLot.com.au emphasises the strategic value of these insights for future planning, empowering stakeholders to identify emerging markets, align with buyer demand, and anticipate evolving construction trends.
As the platform continues to integrate these findings, it reaffirms its commitment to connecting Australians with homes and communities that mirror their aspirations, cementing OpenLot’s role at the forefront of the nation’s housing transformation.


