The Australian real estate landscape is a dynamic tapestry, woven with regional nuances and market intricacies that demand a keen understanding. This is a brief analysis of the Australian Bureau of Statistics (ABS) data for five pivotal states: Queensland, New South Wales, Victoria, South Australia, and Western Australia. This data delves into the intricate details of Small Area 2 (SA2) regions, providing invaluable insights into the construction trends of new houses and the associated average building costs.
Navigating the Urban Fabric
Australia's real estate story unfolds uniquely in each state, shaped by economic drivers,
population dynamics, and lifestyle preferences. This report begins in Queensland, where
coastal paradises, burgeoning urban centres, and tranquil hinterlands create a mosaic of
housing demands. Moving south to New South Wales, we dissect the diverse housing markets, from the cosmopolitan allure of Sydney to the regional charm of Albury. Victoria, with its vibrant mix of metropolitan hubs and regional landscapes, offers a nuanced narrative in the housing realm.
Decoding Market Dynamics
This report meticulously dissects the ABS data to uncover patterns, trends, and opportunities within the SA2 areas. New South Wales showcases a spectrum of housing dynamics, from the burgeoning suburban landscapes of Box Hill to the coastal allure of Lennox Head. South Australia, with its unique blend of urban and regional lifestyles, presents insights into housing trends in areas like Munno Para West and Mount Barker. Meanwhile, Western Australia's vast expanse unfolds from the coastal allure of Alkimos to the burgeoning suburbs of Byford.
Strategic Insights for OpenLot.com.au
Armed with this wealth of information, OpenLot.com.au encourages key partners and
stakeholders to make informed and strategic decisions in navigating the diverse real estate
markets across these five states. The analysis not only provides a snapshot of current
construction trends but also serves as a compass for future endeavours. From capitalising on growth corridors to understanding the nuances of premium markets, you can leverage these insights to tailor its offerings, strengthen community engagement, and position itself as a beacon in the ever-evolving Australian real estate landscape.
New South Wales
This report delves into the housing data for New South Wales, focusing on Small Area 2 (SA2) regions. The data encompasses the number of new houses and the average building cost in each SA2 area.
Key Findings
New House Approvals:
Overall, new house approvals in New South Wales (NSW) decreased by 9.09% year-over-year (YOY). Some areas experienced significant drops, like the Far West and Orana region with a 46.02% decrease and the Northern Beaches with a 26.86% decrease. However, some regions saw increases in approvals, such as Coffs Harbour-Grafton with a 24.73% increase and Newcastle and Lake Macquarie with a 15.10% increase.
Average Building Costs:
The average building cost in Greater Sydney increased by 6.93% to $534,137. Some regions saw substantial cost increases, like Far West and Orana with a 31.25% rise and Richmond-Tweed with a 23.65% increase. Conversely, some areas experienced a decline in building costs, such as the Riverina region with a 14.45% decrease and the Sydney - City and Inner South area with a 10.15% decrease.
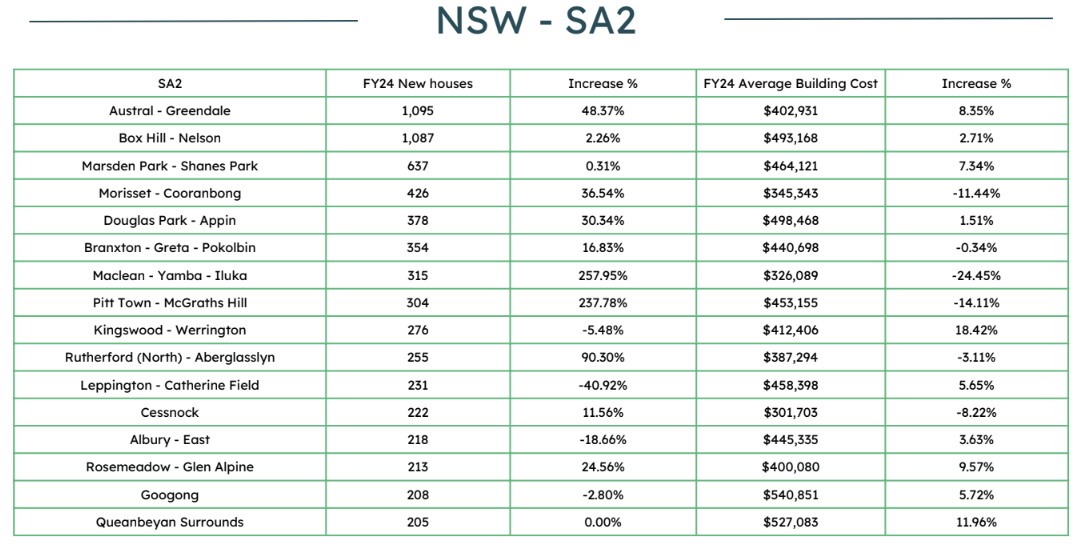
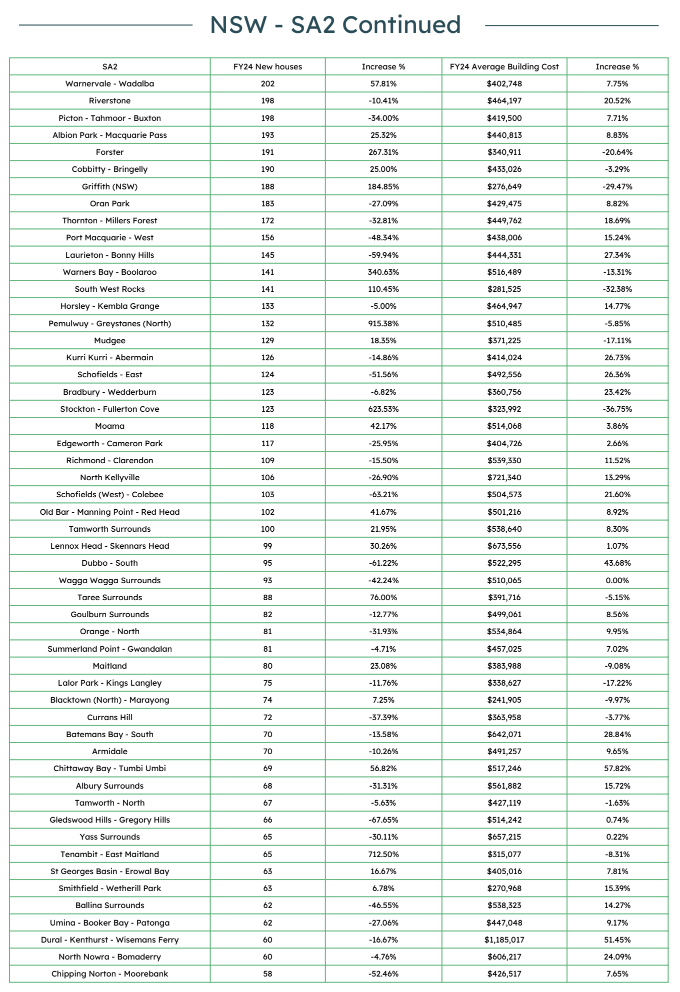
Notable SA2 Regions:
Austral-Greendale: New house approvals increased by 48.37%, with an average building cost increase of 8.35%. Maclean-Yamba-Iluka: A significant increase in new house approvals by 257.95%, but a decrease in building costs by 24.45%. Warners Bay-Boolaroo: Experienced a massive 340.63% increase in new house approvals, though building costs decreased by 13.31%. Stockton-Fullerton Cove: Saw an extraordinary 623.53% increase in new house approvals, though building costs dropped by 36.75%.
High-Increase Areas:
Pemulwuy-Greystanes (North) saw an exceptional 915.38% increase in new house approvals, though building costs decreased by 5.85%. Forster recorded a 267.31% increase in new house approvals, but with a 20.64% reduction in building costs. Griffith (NSW): An increase of 184.85% in new house approvals, with building costs dropping by 29.47%.
Areas with Notable Cost Increases:
Dubbo-South experienced the highest increase in average building costs at 43.68%, despite a 61.22% decline in new house approvals. Dural-Kenthurst-Wisemans Ferry saw a 51.45% rise in building costs, with a 16.67% decrease in house approvals.
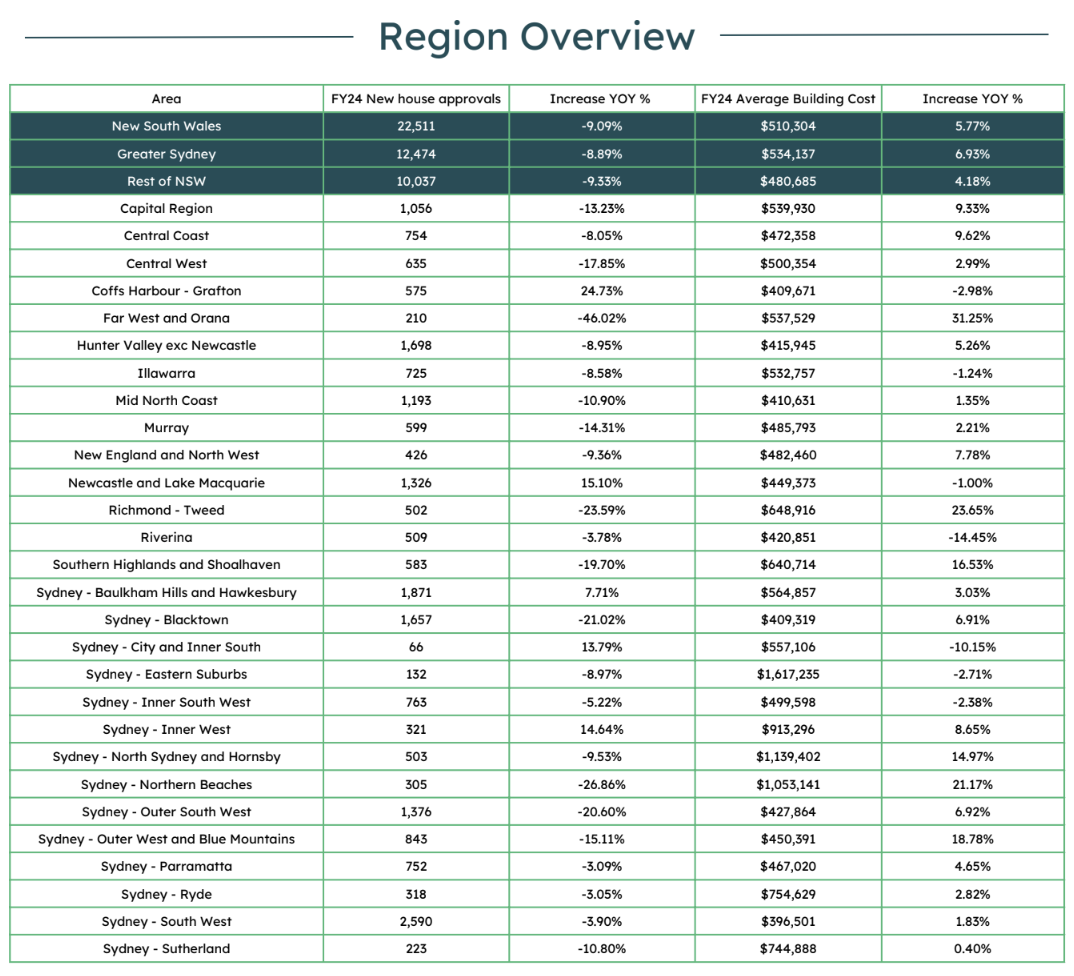
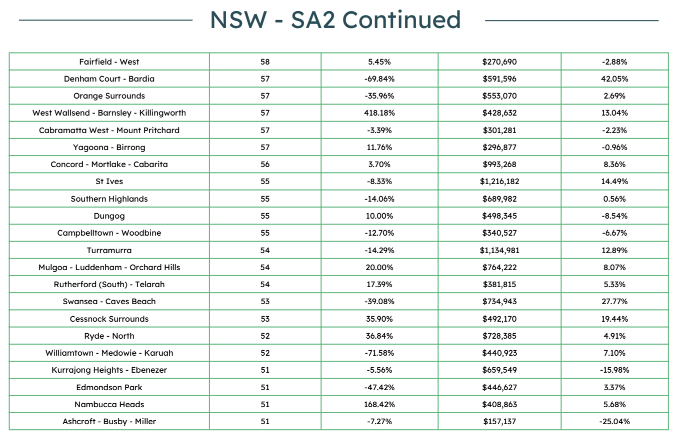
In the 2023-2024 financial year, New South Wales experienced a 9.09% decline in new house approvals, with the average building cost increasing by 5.77% to $510,304. Greater Sydney saw a similar trend with an 8.89% drop in approvals and a 6.93% rise in costs. Some regions, like Far West and Orana, faced a steep 46.02% decrease in approvals but saw building costs soar by 31.25%. Meanwhile, areas such as Newcastle and Lake Macquarie enjoyed a 15.10% increase in approvals, despite a modest 1.00% decrease in costs. These figures highlight a challenging yet varied market across NSW, with significant regional disparities in housing activity and construction costs.
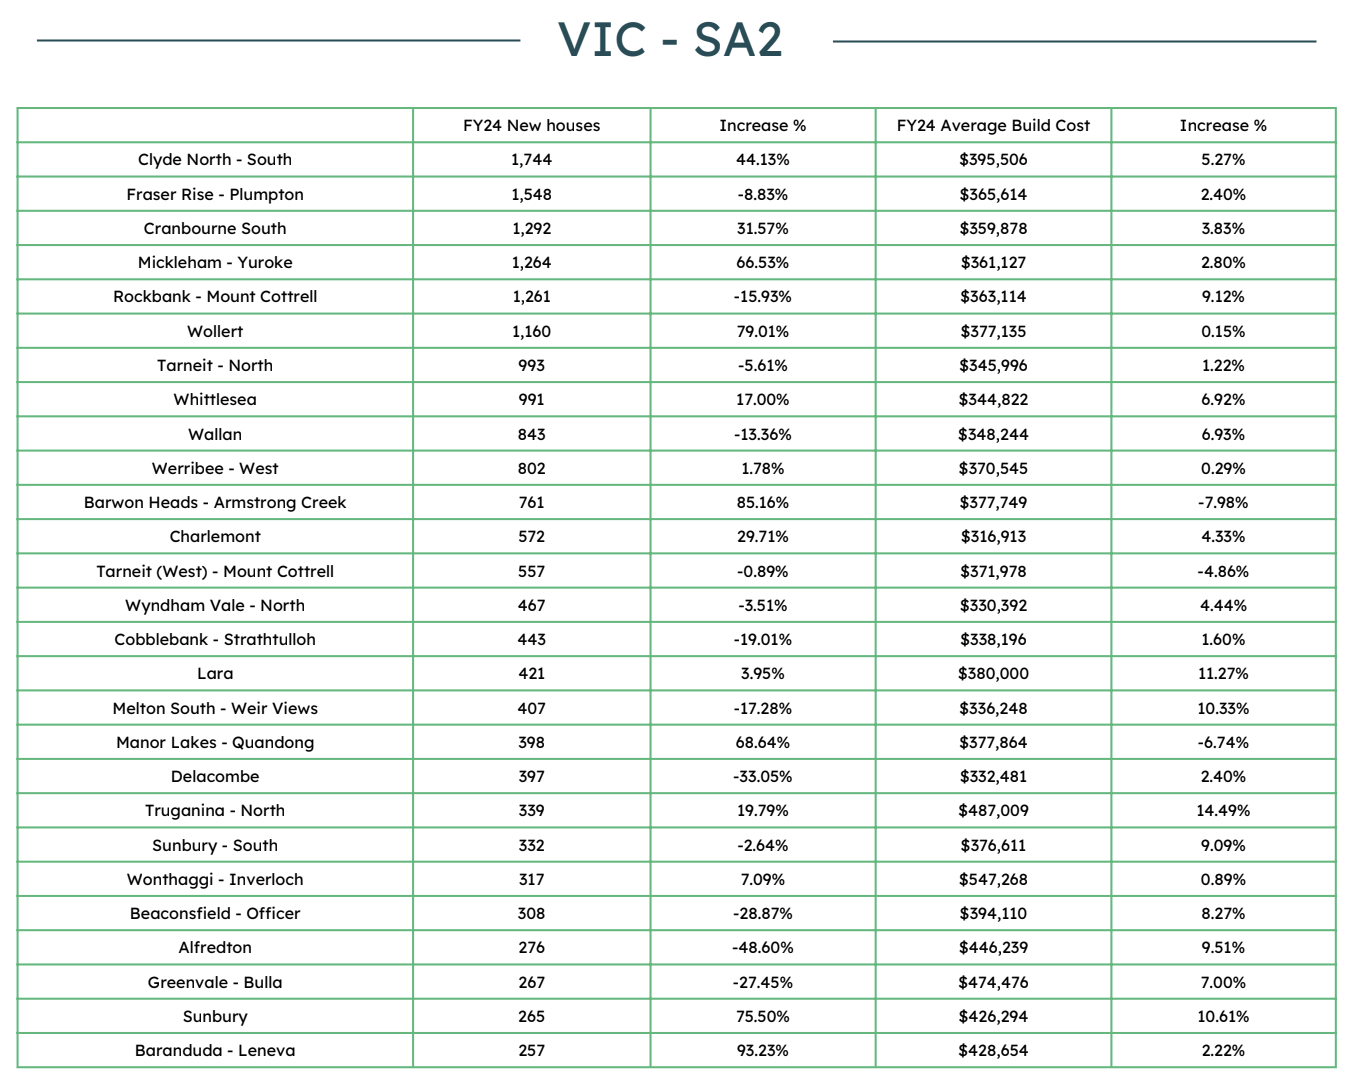
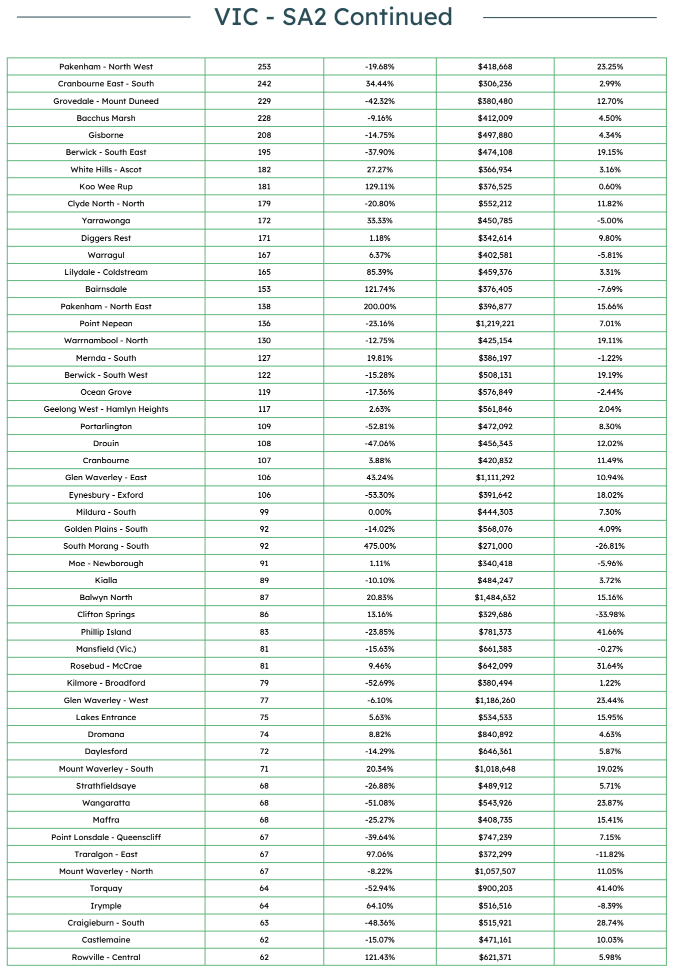
Victoria
This report delves into the housing data for Victoria, focusing on Small Area 2 (SA2) regions. The data encompasses the number of new houses and the average building cost in each SA2 area.
Key Findings
New House Approvals:
In Victoria, there was a decrease in new house approvals by 2.59%, totalling 33,437 units for FY24. Greater Melbourne saw an increase in approvals by 2.00% with 24,352 units, whereas the rest of Victoria experienced a significant decline of 13.09%, amounting to 9,085 units. Notably, areas like Ballarat and Bendigo saw sharp decreases in approvals by 32.69% and 14.51%, respectively.
Average Building Costs:
The average building cost across Victoria rose by 6.67% to $489,160. Greater Melbourne recorded a slightly higher increase of 6.85%, reaching an average cost of $497,856. In contrast, the rest of Victoria saw a lower increase of 5.45%, with average costs at $465,852. Melbourne’s Inner City experienced the most substantial increase in building costs, skyrocketing by 65.16% to $1,820,351.
Notable SA2 Regions:
The Melbourne - Inner region reported the highest cost, with an average building cost reaching $1,820,351, which is a 65.16% increase, highlighting it as the most expensive area. Other notable regions include Melbourne - Inner East and South with considerable increases in building costs, showcasing the high-end market dynamics in these urban areas.
High-Increase Areas:
Clyde North - South and Barwon Heads - Armstrong Creek saw the highest increases in new house approvals, with 44.13% and 85.16%, respectively. These areas are burgeoning growth spots, indicating a robust demand for new housing developments in these suburban locales.
Areas with Notable Cost Increases:
Berwick - South East and Cranbourne East - South noted the most significant spikes in building costs at 19.15% and 34.44%, respectively. These areas, along with Eynesbury - Exford, which saw an 18.02% rise in costs, are experiencing rapid developments, reflecting the growing expense of construction and development in these regions.
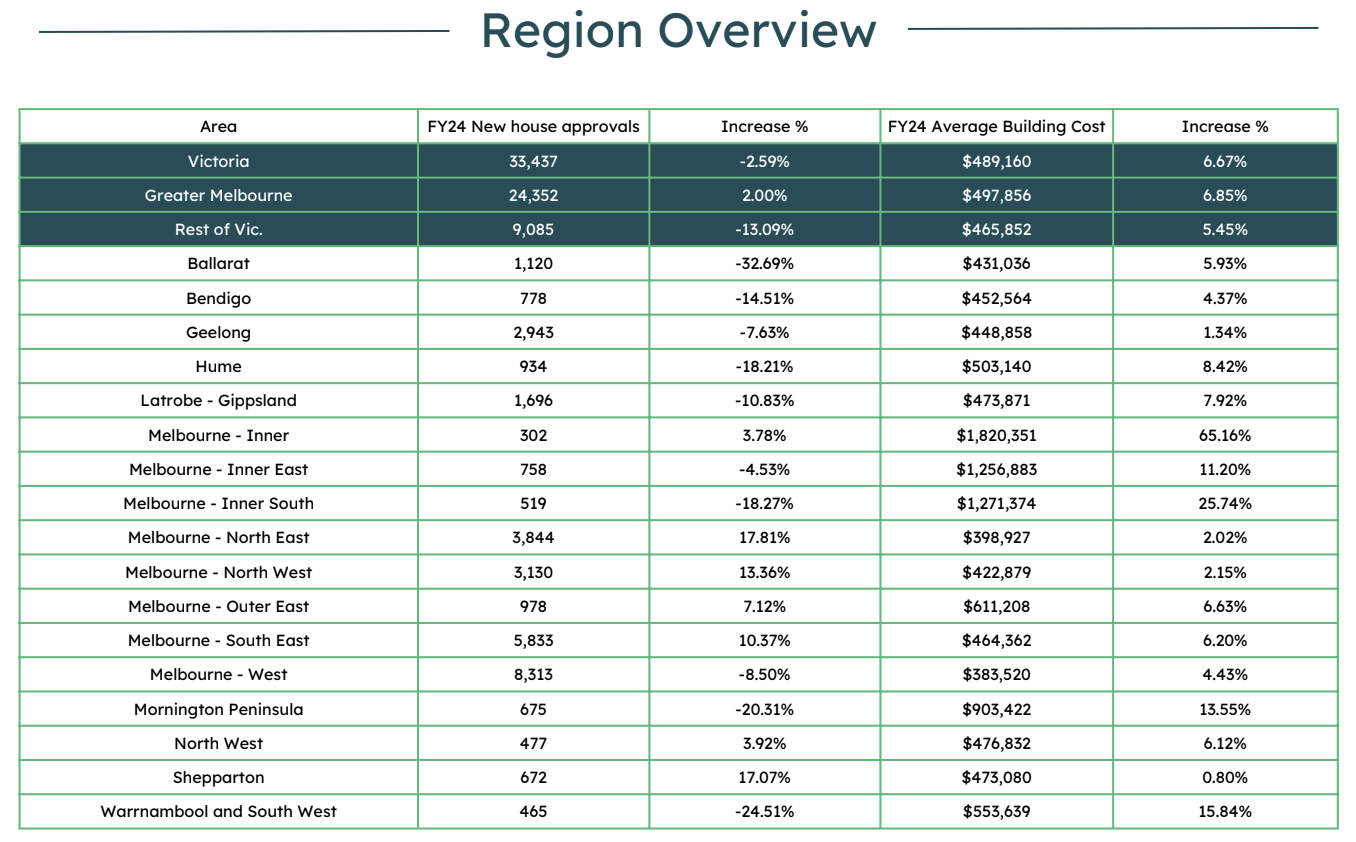
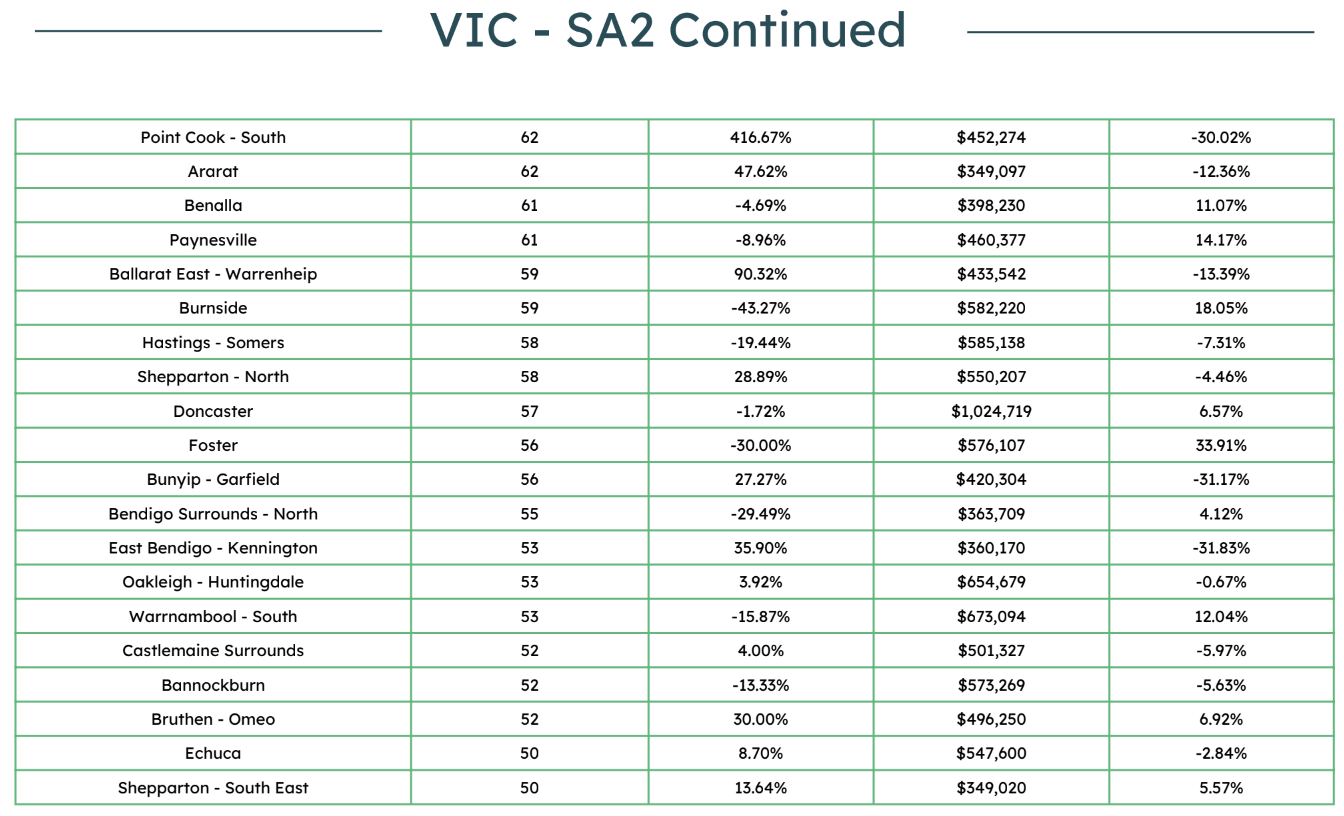
In Victoria during FY24, new house approvals decreased by 2.59% overall, with Greater Melbourne witnessing a 2.00% increase, while the rest of Victoria saw a 13.09% decrease. The average building cost in the state rose by 6.67% to $489,160, with the most notable spikes in Melbourne's Inner City, where costs soared by 65.16% to $1,820,351. High-increase areas such as Clyde North - South and Barwon Heads - Armstrong Creek experienced substantial growth in house approvals, by 44.13% and 85.16% respectively, pointing to robust demand in these regions. Conversely, areas like Berwick - South East and Cranbourne East - South faced the highest increases in building costs, reflecting the escalating expenses associated with new developments in these burgeoning locales. This dynamic suggests a shifting landscape in Victoria's real estate market, with particular suburban areas showing significant growth in both demand and construction costs.
Queensland
This report delves into the housing data for Queensland, focusing on Small Area 2 (SA2) regions. The data encompasses the number of new houses and the average building cost in each SA2 area.
Key Findings
New House Approvals:
In Queensland, there has been a slight overall increase in new house approvals, totalling 21,553, which is a 0.77% rise from the previous year. Greater Brisbane experienced a significant increase, with 12,774 new approvals marking an 8.78% increase. In contrast, the rest of Queensland saw a decline in approvals, with 8,779 new houses approved, representing an 8.99% decrease.
Average Building Costs:
The average building costs in Greater Brisbane have risen to $446,883, reflecting a 5.72% increase. The costs are higher in the rest of Queensland, averaging $520,710, up by 10.39%. This highlights a trend of rising construction costs across the region.
Notable SA2 Regions:
The Brisbane Inner City stands out with the highest average building cost at $1,266,783, which has surged by 23.42%. Moreton Bay - North also saw a notable increase in approvals by 22.06%, though there was a slight reduction in building costs by 0.77%.
High-Increase Areas:
Springfield Lakes and Morayfield have seen dramatic increases in housing approvals. Springfield Lakes had a 143.20% increase in approvals, whereas Morayfield experienced a massive 223.31% rise, indicating a rapid expansion in these areas.
Areas with Notable Cost Increases:
Brisbane - West and Sunshine Coast are areas with significant increases in building costs. Brisbane - West saw the highest cost increase of 18.83%, and the Sunshine Coast also experienced a substantial rise in costs by 17.31%. These figures suggest that certain areas are experiencing much higher construction cost inflation compared to others.
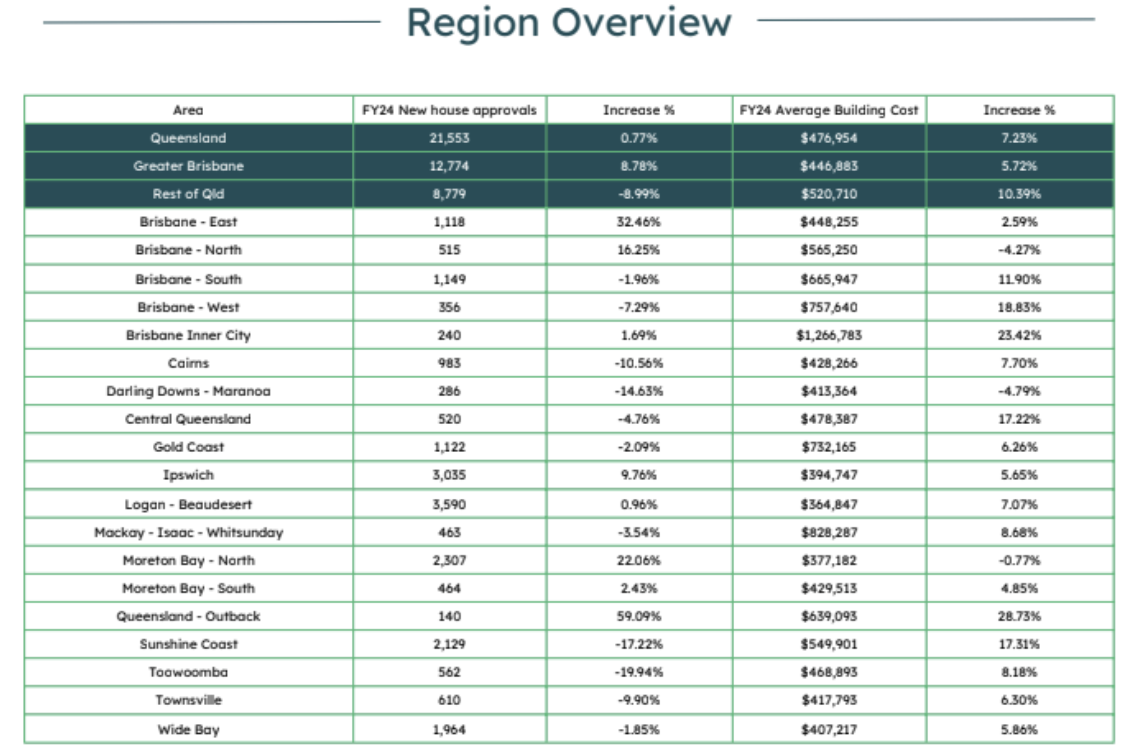
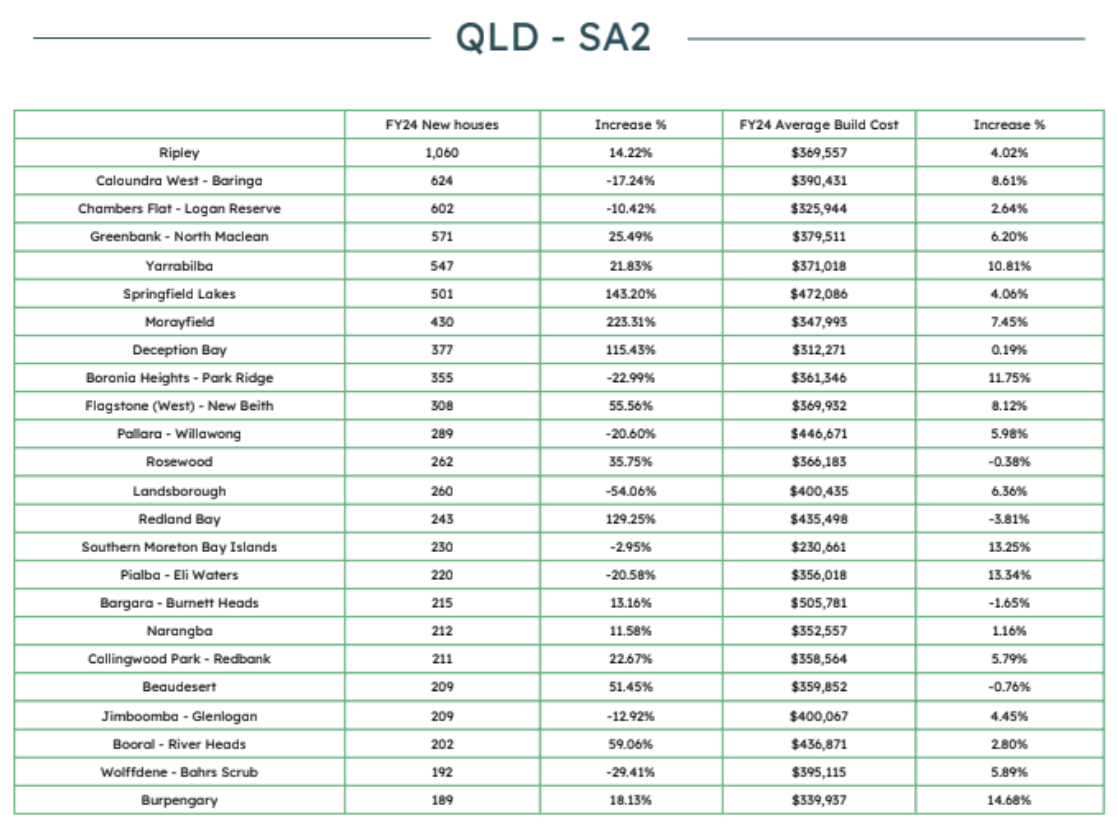
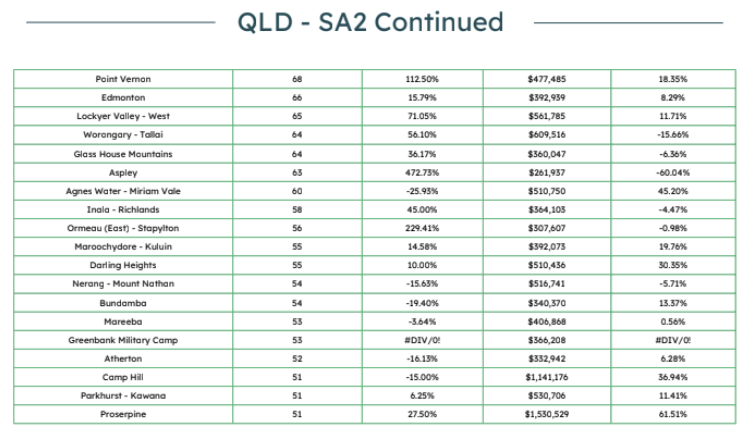
In Queensland, new house approvals saw a modest overall increase to 21,553 units, led by a significant 8.78% rise in Greater Brisbane, though the rest of Queensland experienced an 8.99% decline. Building costs mirrored this growth, with Greater Brisbane and the wider region seeing increases of 5.72% and 10.39% respectively, pushing average costs to $446,883 in Brisbane and $520,710 elsewhere. Notably, the Brisbane Inner City area experienced the steepest rise in building costs at 23.42%, reaching $1,266,783. In terms of approvals, Springfield Lakes and Morayfield witnessed the most substantial hikes, at 143.20% and 223.31% respectively, while Brisbane - West and the Sunshine Coast saw the largest increases in building expenses, at 18.83% and 17.31%. These figures highlight both the expanding market in specific areas and the rising costs associated with new home constructions across the state.
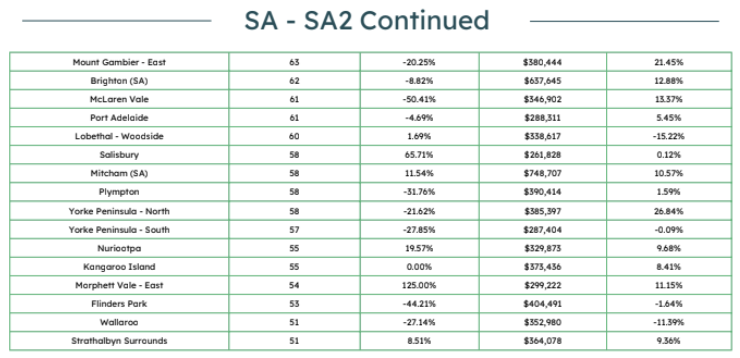
South Australia
This report delves into the housing data for South Australia, focusing on Small Area 2 (SA2) regions. The data encompasses the number of new houses and the average building cost in each SA2 area.
Key Findings
New House Approvals:
In South Australia, there was a decline in new house approvals by 7.42%, totalling 8,941 units in FY24. Greater Adelaide saw a decrease of 5.62% with 6,942 units, while the rest of SA experienced a more significant drop of 13.20%, totaling 1,999 units. Specific areas like Barossa - Yorke - Mid North and South Australia - Outback saw sharp decreases of 22.96% and 29.41%, respectively.
Average Building Costs:
The average building cost in South Australia rose by 7.29% to $377,665. Within Greater Adelaide, the average was slightly higher at $381,666, reflecting a 7.42% increase. The rest of SA saw a smaller increase of 6.54%, with average costs at $363,769. Notable for its high costs, Adelaide - Central and Hills had an average building cost of $489,605, up by 10.54%.
Notable SA2 Regions:
The Adelaide - Central and Hills region reported the highest increase in building costs by 10.54%, reaching $489,605. The Adelaide - West area experienced the most significant drop in new house approvals at 14.78%, but saw a considerable increase in building costs by 12.80%. Conversely, the Barossa - Yorke - Mid North region witnessed the most substantial decrease in approvals, down by 22.96%.
High-Increase Areas:
Significant increases in new house approvals were seen in regions like Gawler - South and Mannum, with increases of 61.18% and 82.14%, respectively. These areas are emerging as high- growth locations, indicating a robust demand for new housing developments.
Areas with Notable Cost Increases:
The regions experiencing notable increases in building costs include Adelaide - West, with a 12.80% increase, and Mount Barker, where costs rose by 12.02%. Other areas like McLaren Vale also saw a significant cost increase of 13.37%, despite a drastic drop in approvals, highlighting a trend towards higher construction expenses in these localities.
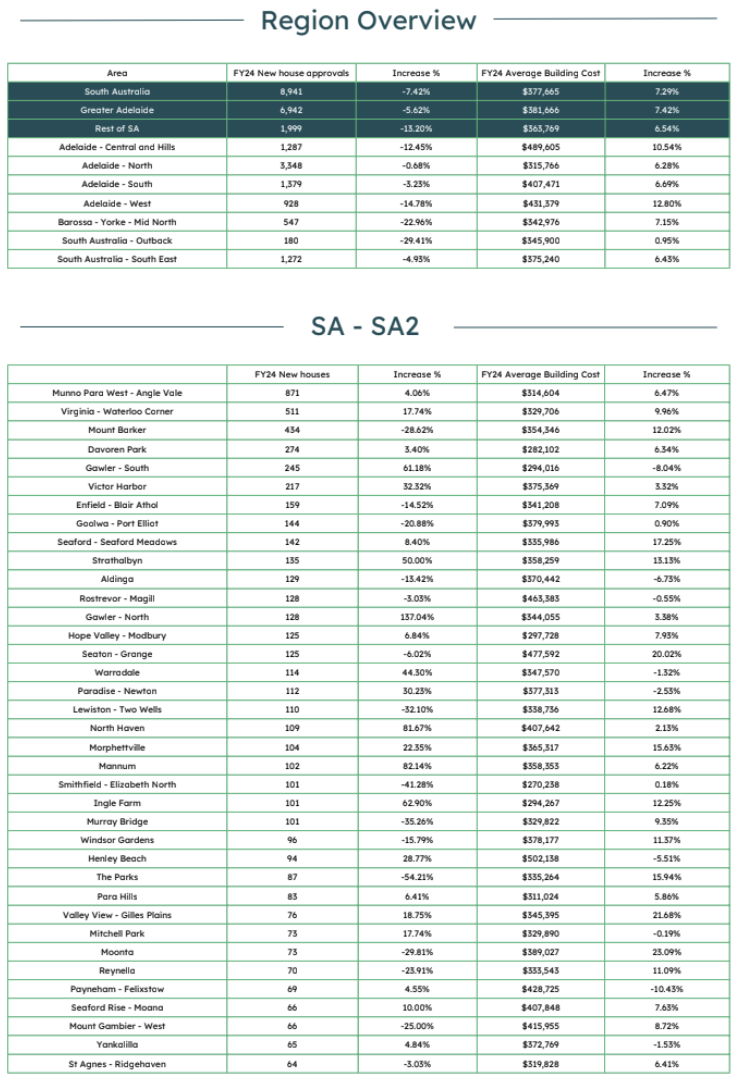
In South Australia during FY24, new house approvals fell by 7.42% to 8,941 units, with Greater Adelaide and the rest of SA experiencing declines of 5.62% and 13.20% respectively, while specific regions like Barossa - Yorke - Mid North and South Australia - Outback saw sharper decreases. Meanwhile, average building costs in the state rose by 7.29% to $377,665, with Adelaide - Central and Hills notably reaching $489,605 after a 10.54% increase. The highest growth in new house approvals occurred in Gawler - South and Mannum, signaling strong housing demand in these high-growth areas. Conversely, Adelaide - West and Mount Barker saw significant cost increases of 12.80% and 12.02%, respectively, indicating a trend toward rising construction expenses despite varying approval rates across the state.
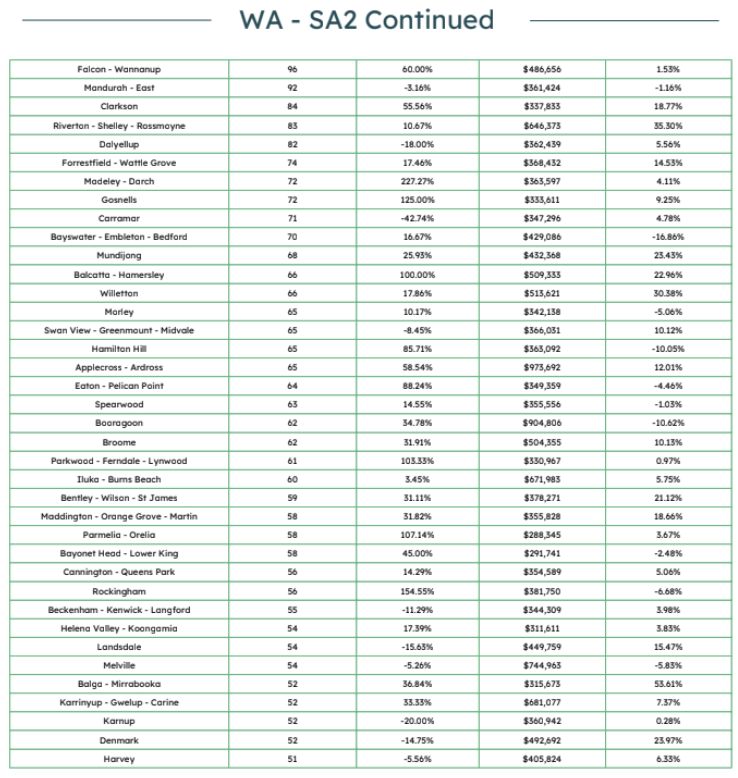
Western Australia
This report delves into the housing data for Western Australia, focusing on Small Area 2 (SA2) regions. The data encompasses the number of new houses and the average building cost in each SA2 area.
Key Findings
New House Approvals:
Western Australia (WA) experienced a 19.57% increase in new house approvals during the 2023- 2024 financial year, with Greater Perth leading the way with a 24.63% increase. While most regions showed positive growth, some areas like Perth - Inner and the Outback (North) saw declines in approvals, with drops of 10.67% and 11.91%, respectively. The highest increase in approvals was seen in Perth - South West, with a significant 36.89% rise.
Average Building Costs:
The average building cost in WA rose by 7.26%, reaching $416,382. The Outback (North) region had the most substantial increase in costs, surging by 72.12%, while Perth - Inner also saw a sharp rise of 42.07%. Conversely, some areas experienced smaller increases or even slight declines, such as Perth - South West, which only saw a minimal 0.16% increase, and Hamilton Hill, which experienced a 10.05% decrease. Notable SA2 Regions: Several SA2 regions in WA recorded notable changes in both approvals and costs. For instance, Ellenbrook had a significant 144.87% increase in approvals but only a 3.14% rise in building costs. Meanwhile, Brabham - Henley Brook experienced a dramatic 92.94% rise in approvals and a 9.23% increase in costs. Other areas like Piara Waters - Forrestdale maintained stable approvals but saw the highest rise in costs at 21.50%.
High-Increase Areas:
Areas with the highest increases in approvals included Perth - South West (36.89%) and Banjup (41.41%). Noteworthy cost surges were seen in the Outback (North) region with a 72.12% increase and Busselton - West with a 37.06% rise. These areas reflect significant growth and rising costs, indicating a robust demand for new housing in these regions.
Areas with Notable Cost Increases:
In addition to the Outback (North) and Busselton - West, other areas such as Perth - Inner and Piara Waters - Forrestdale saw substantial cost increases of 42.07% and 21.50%, respectively. These regions, despite varied approval rates, are facing steep rises in building costs, suggesting a more expensive housing market in certain parts of WA.
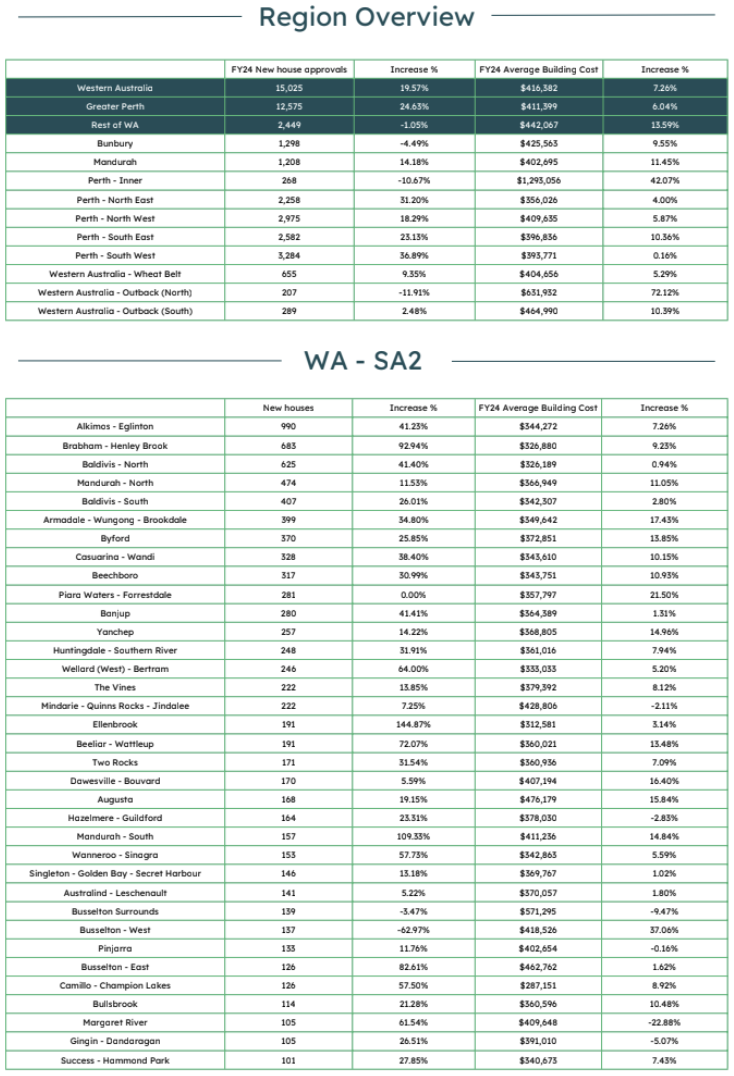
Western Australia saw a 19.57% rise in new house approvals for the 2023-2024 financial year, with Greater Perth leading at 24.63%. Building costs increased by 7.26% on average, with the Outback (North) and Perth - Inner regions experiencing the most significant cost surges at 72.12% and 42.07%, respectively. Notable SA2 regions like Ellenbrook and Brabham - Henley Brook saw dramatic increases in approvals, while areas such as Piara Waters - Forrestdale and Busselton - West faced steep rises in building costs. The mixed trends across WA reflect varied demand and cost pressures in different regions.
Conclusion
The comprehensive analysis of ABS data for Queensland, New South Wales, Victoria, South Australia, and Western Australia has unveiled a rich tapestry of real estate dynamics. OpenLot emphasises the strategic importance of these insights for your future endeavours. The nuanced understanding of SA2 areas, new house construction trends, and average building costs equips you with a potent tool to navigate the intricate terrains of each state's real estate market.
The granularity of the data allows homeowners, developers, and investors to not only identify burgeoning markets and capitalise on growth opportunities but also to tailor its services to meet the diverse demands of homeowners and investors. From the coastal allure of Lennox Head in New South Wales to the burgeoning suburbs of Byford in Western Australia, these insights serve as a compass, guiding towards a future where it can continually adapt, thrive, and remain at the forefront of Australia's dynamic real estate landscape.
As the platform integrates these findings into its strategic planning, it solidifies its commitment to providing users with not just homes, but tailored opportunities that align with their unique aspirations and the evolving pulse of the real estate market.


