
The New South Wales new-homes market saw a strong rebound in Q3 2025, with buyer confidence returning and enquiry volumes climbing well above the annual average. This uplift was underpinned by lower interest rates, stable economic sentiment, and a noticeable surge in weekend buyer activity, signalling renewed momentum heading into the final quarter of the year.
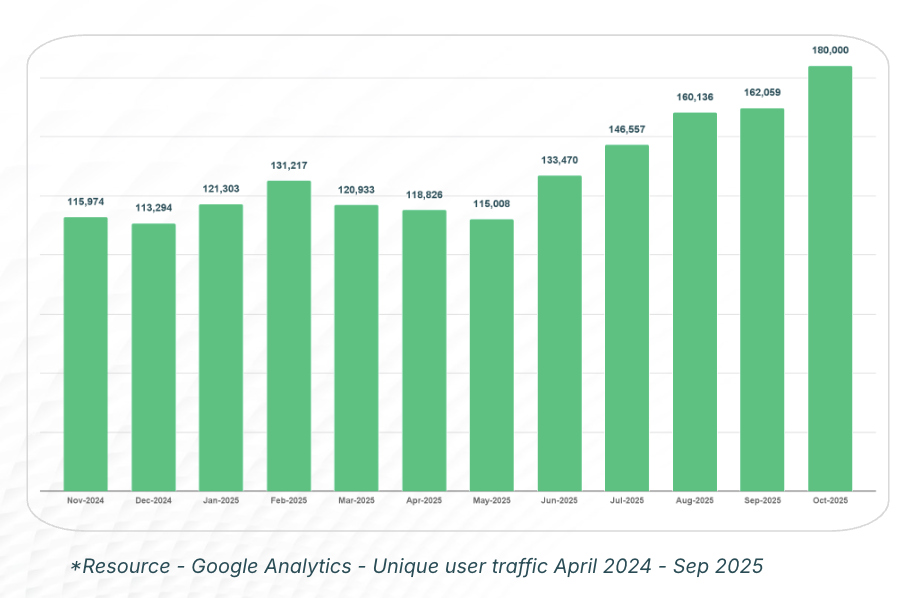
Unique Audience Trends
Nationally, OpenLot’s unique audience reached a record 162,059 in September 2025, a 21% rise from the end of Q2. The sustained increase from July through September reflected improving confidence in the new-homes sector, supported by a more stable lending climate and seasonal market activity.
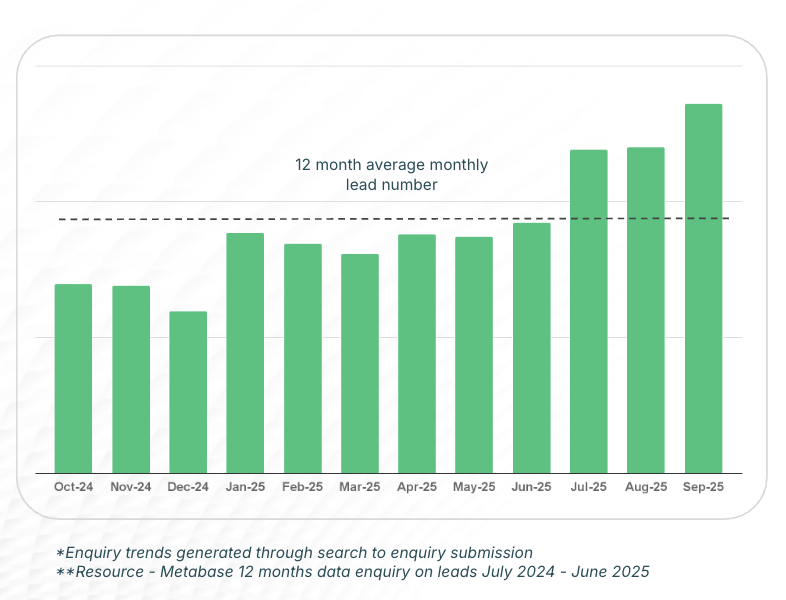
Enquiry Trends
Across New South Wales, enquiries surged throughout the quarter, with July, August, and September all exceeding the 12-month average. September recorded the highest enquiry levels of the year, driven by positive media coverage on interest-rate stability and government housing incentives. These factors contributed to renewed buyer optimism and sustained lead growth across key regions.
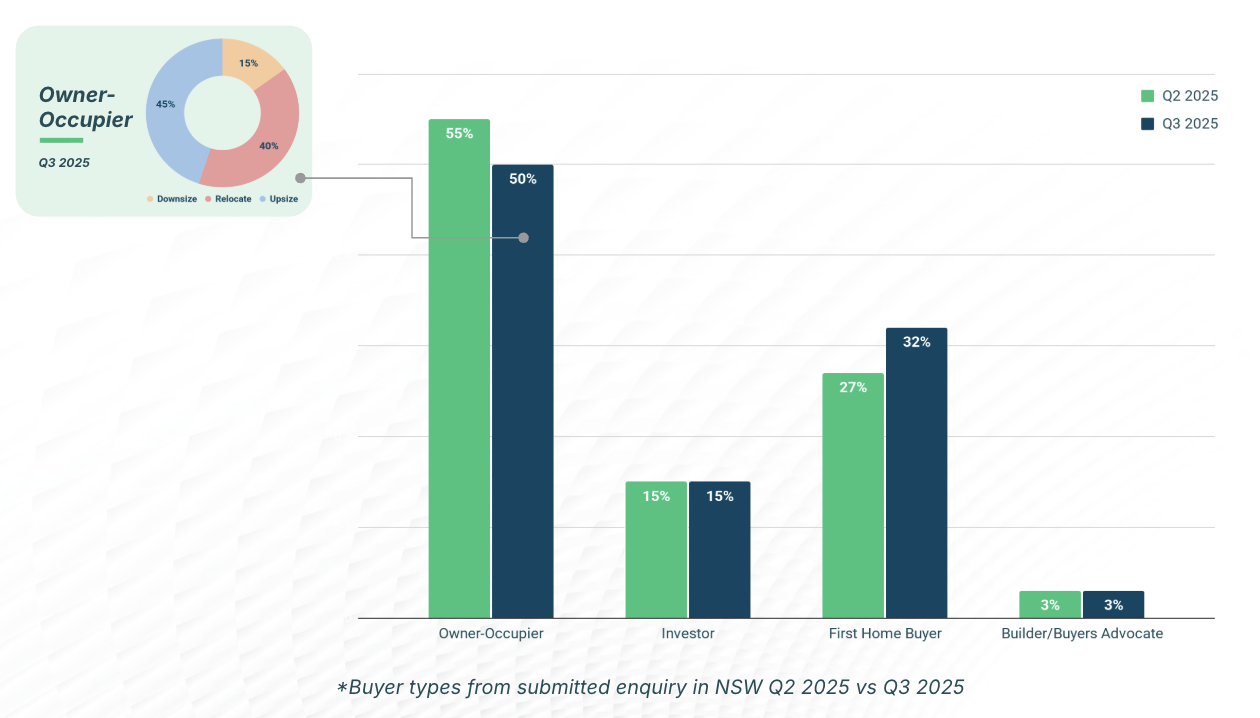
Buyer Types
Owner-occupiers continued to dominate, representing 50% of all enquiries, followed by investors (15%) and first-home buyers (32%). Builder-buyer advocates accounted for 3%, indicating that the majority of NSW leads remain driven by end-user interest rather than speculative demand.
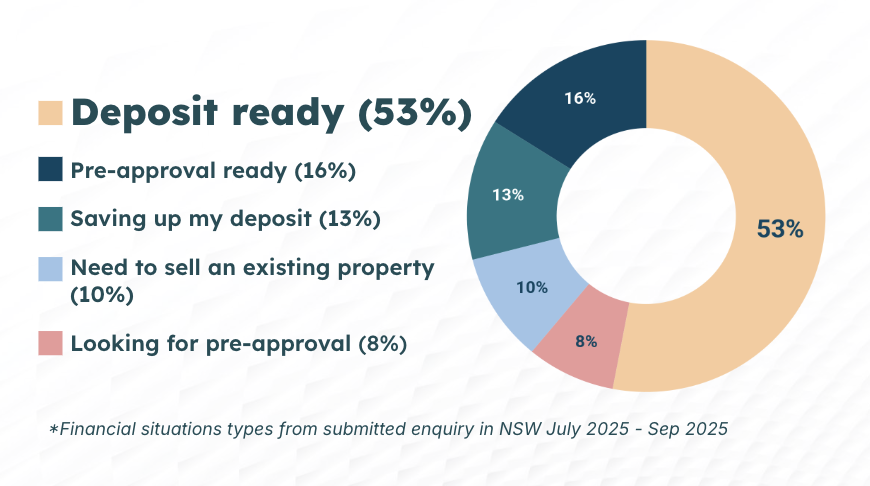
Financial Readiness
A majority of NSW buyers (53%) were deposit-ready, while 16% already held loan pre-approvals. A further 13% were still saving deposits, 10% needed to sell an existing property, and 8% were beginning the pre-approval process. Notably, cash buyers declined by 19%, marking a shift towards more financed purchasers. The strongest growth categories included those looking for pre-approval (+200%), refinancing (+150%), and deposit-ready buyers (+76%).
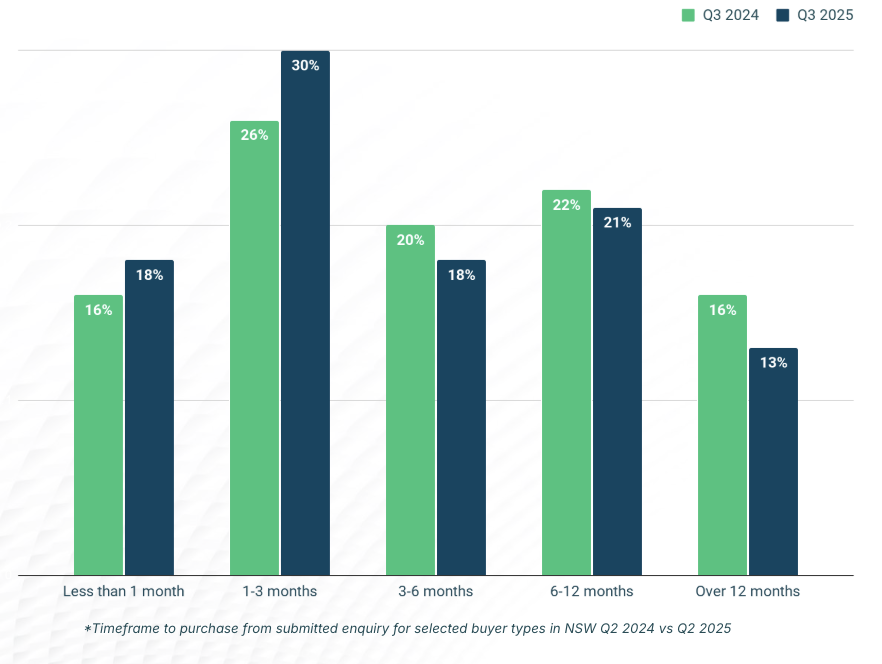
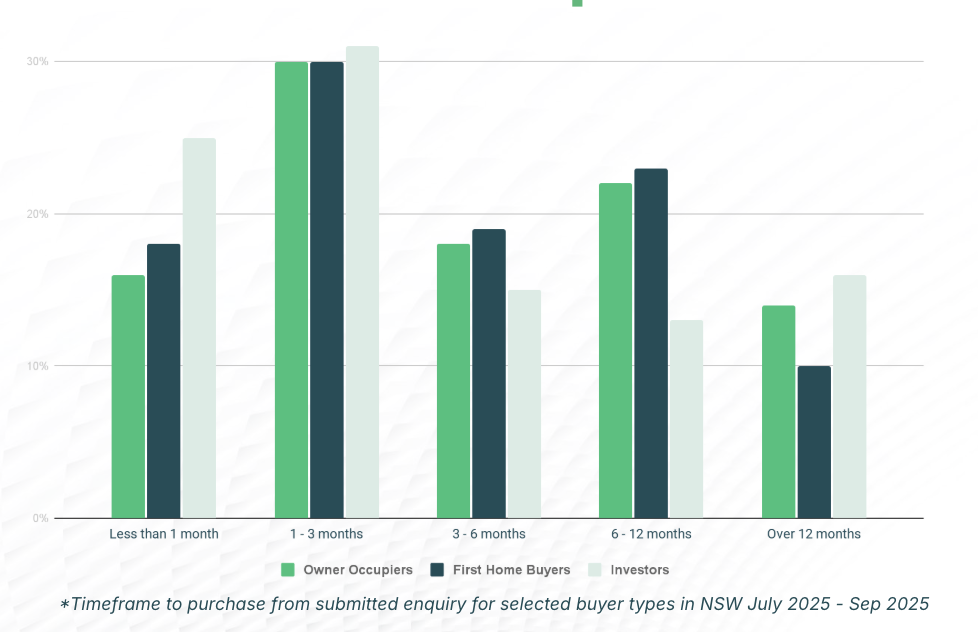
Timeframe to Purchase
Buyer urgency increased across NSW. The largest cohort planned to purchase within 1–3 months, followed by those intending to buy within 3–6 months. Only a small proportion indicated a timeframe beyond 12 months, underscoring a more active and decisive market segment. The charts on pages 10–11 show a consistent pattern across owner-occupiers, first-home buyers, and investors, all demonstrating heightened readiness to purchase in the short term.
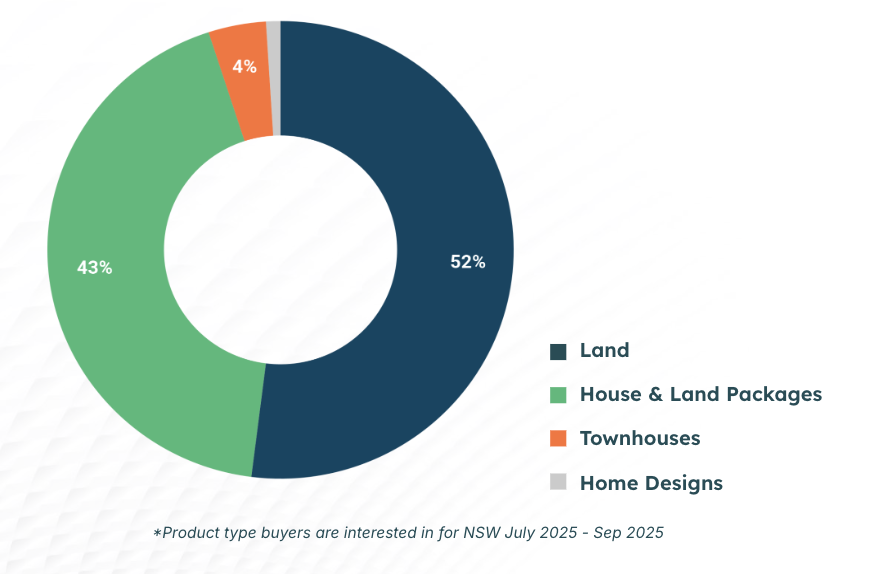
Product Demand
Interest was split mainly between land (52%) and house-and-land packages (43%), while townhouses (4%) and home designs (1%) represented smaller yet growing categories. These proportions illustrate an enduring preference among NSW buyers for detached-style living with flexibility to customise builds.
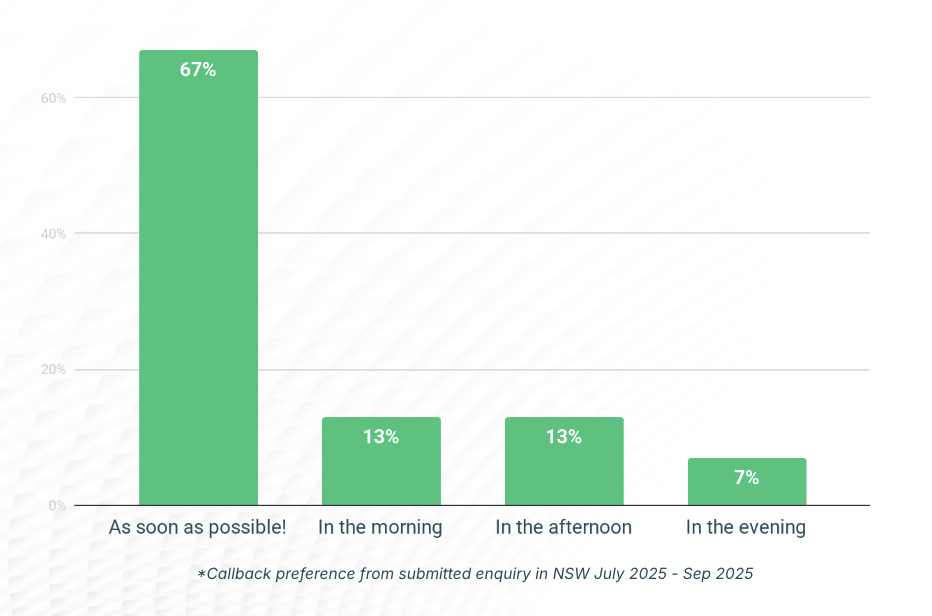
Buyer Callback Preference
Timely response remains critical: 67% of buyers requested to be contacted as soon as possible, with only 13% preferring morning or afternoon calls and 7% choosing evening contact. The data highlight that rapid engagement continues to be key in converting high-intent leads.
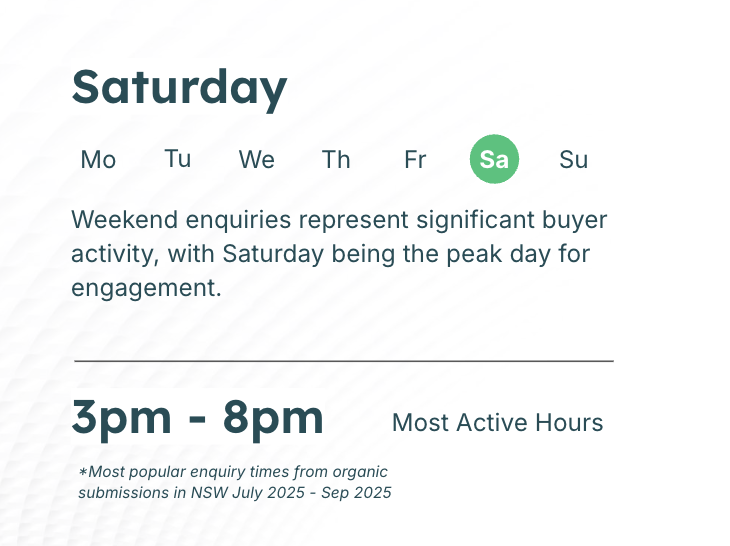
Most Popular Enquiry Times
The chart on page 15 reveals that weekends dominate enquiry activity, with Saturday emerging as the peak day for engagement. The most active hours were 3 pm – 8 pm, indicating that NSW buyers primarily research and enquire outside standard business hours.
Lead Maximiser Insights
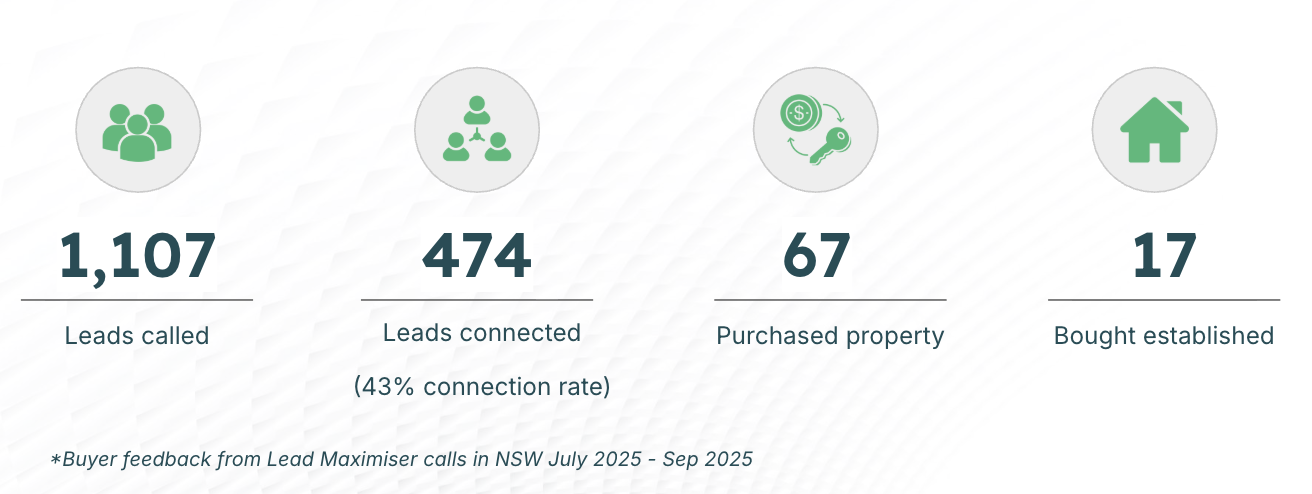
OpenLot’s Lead Maximiser team contacted 1,107 leads in Q3, successfully connecting with 474 buyers (43% connection rate). Of these, 67 had purchased property and 17 bought established homes. However, 11% of leads reported no follow-up from sales agents, underlining the continued importance of prompt communication for sales success.
Buyer Survey
Barriers to purchase:
• Waiting to sell an existing property or access funds
• Limited land sizes and design availability
• Rising land and construction costs
Preferred product types:
• Owner-occupiers – new homes
• First-home buyers – new homes
• Investors – no data captured this quarter
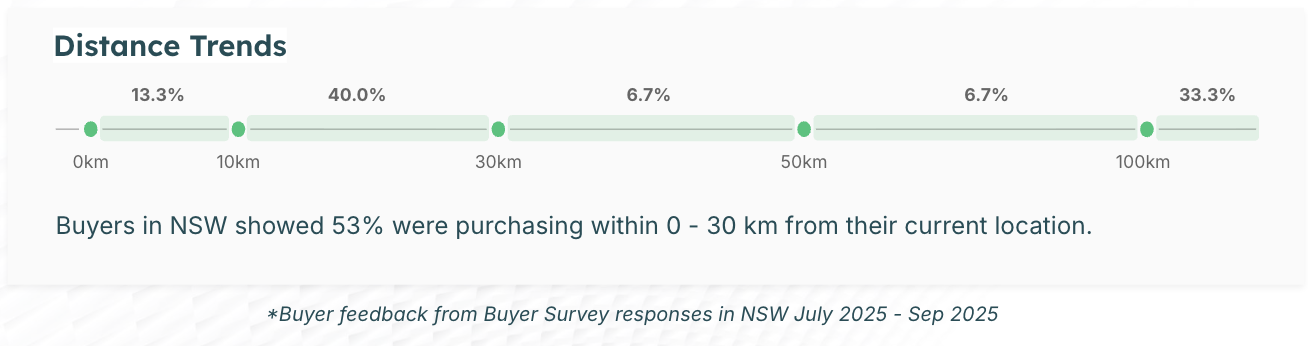
Distance trends:
A majority (53%) of NSW buyers were purchasing within 0–30 km of their current location, demonstrating strong loyalty to familiar areas and established community networks.
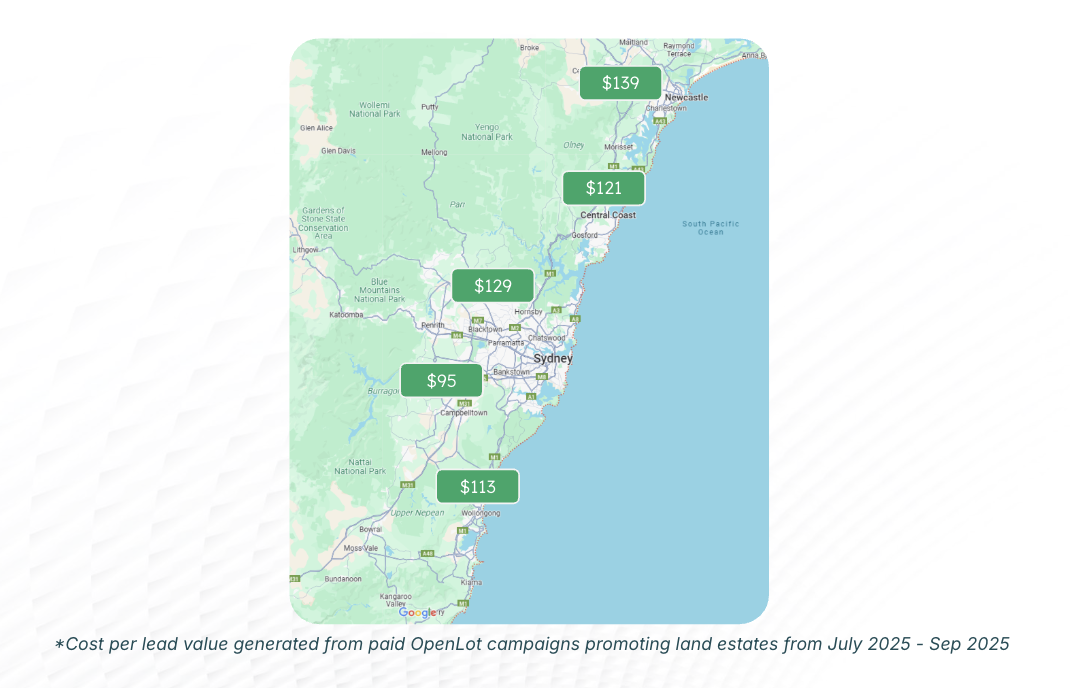
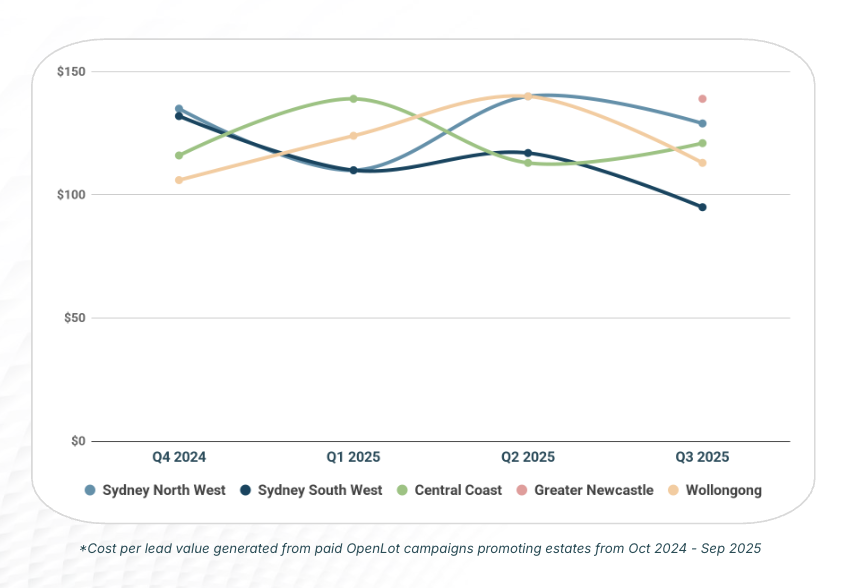
Average Cost Per Lead (CPL)
Across NSW, paid campaigns generated competitive cost-per-lead results:
• Sydney North West – $129
• Sydney South West – $95
• Central Coast – $121
• Greater Newcastle – $113
• Wollongong – $139
These outcomes reflect steady performance across regional markets, with metro areas trending slightly higher due to intensified competition. The trend chart on page 19 confirms stable or declining CPLs over the past three quarters, indicating improved campaign efficiency.
New South Wales closed Q3 2025 with renewed strength in buyer confidence, heightened enquiry volumes, and robust financial readiness among purchasers. With the majority of leads seeking immediate follow-up and over half of buyers poised to purchase within three months, the state’s residential land market appears well-positioned for sustained growth into Q4 and early 2026.


