2026 National ABS Housing Data Report by OpenLot.com.au.
Add as a preferred source on Google
The Australian housing landscape continues to evolve through metropolitan expansion, regional growth and changing construction costs. This FY26 analysis draws on ABS housing data across New South Wales, Victoria, Queensland, the Australian Capital Territory, South Australia and Western Australia, focusing on SA2 regions to identify movements in new housing activity and average building costs.
Navigating the Urban Fabric
Housing activity varied considerably across the six jurisdictions. Western Australia and Queensland recorded particularly high volumes, led by Alkimos – Eglinton with 1,527 new houses and Ripley with 1,502, while Victoria's Rockbank – Mount Cottrell recorded 1,481. New South Wales was led by Austral – Greendale with 1,058, South Australia's Munno Para West – Angle Vale recorded 1,205, and the ACT's smaller market was led by Macnamara with 136. These results highlight continued activity across outer-metropolitan growth corridors alongside emerging regional and lifestyle markets.
Decoding Market Dynamics
FY26 data reveals significant differences between housing growth and construction costs. Major increases included Midland – Guildford in Western Australia, up 485.71 per cent; Cashmere in Queensland, up 497.50 per cent; Anna Bay in New South Wales, up 2,437.50 per cent; Woodcroft in South Australia, up 1,240.00 per cent; Cranbourne East – North in Victoria, up 846.67 per cent; and Taylor in the ACT, up 112.50 per cent. At the premium end, average building costs reached $1,974,021 in Airlie – Whitsundays, $1,753,964 in Balwyn North, $1,481,790 in Nedlands – Dalkeith – Crawley, $1,190,636 in St Ives and $1,087,509 in Burnside – Wattle Park, illustrating the substantial variation in construction values nationally.
Strategic Insights for OpenLot.com.au
The FY26 results highlight opportunities for OpenLot.com.au across high-volume growth corridors, rapidly expanding regional markets and premium residential areas. Markets such as Austral – Greendale, Rockbank – Mount Cottrell, Ripley, Munno Para West – Angle Vale and Alkimos – Eglinton demonstrate continued development activity, while emerging regional and lifestyle locations broaden opportunities beyond traditional metropolitan growth areas. Premium markets such as Balwyn North, St Ives, Burnside – Wattle Park and Nedlands – Dalkeith – Crawley also demonstrate the value of understanding construction costs alongside housing activity when identifying developer opportunities and evolving buyer demand.

This report delves into the housing data for New South Wales, focusing on Small Area 2 (SA2) regions. The data encompasses the number of new houses and the average building cost in each SA2 area.
Key Findings
New House Approvals:
In New South Wales, new house approvals shifted considerably across regions in FY26, with major growth corridors recording strong activity alongside significant increases in several regional and emerging markets. Austral – Greendale recorded the highest volume with 1,058 approvals, increasing by 28.55%, while Box Hill – Nelson recorded 872 approvals despite a 13.41% decline. Douglas Park – Appin rose by 86.06% to 534 approvals, Rosemeadow – Glen Alpine increased by 34.44% to 527, and Leppington – Catherine Field grew by 14.79% to 489. Other significant increases were recorded in Schofields – East, up 124.11% to 316 approvals, Morisset – Cooranbong, up 87.35% to 311, and Albion Park – Macquarie Pass, up 75.12% to 352. In contrast, Kurri Kurri – Abermain declined by 46.23% to 114 approvals, Warnervale – Wadalba fell by 42.71% to 110, Queanbeyan Surrounds declined by 40.66% to 108, and Gledswood Hills – Gregory Hills fell by 38.01% to 137.
Average Building Costs:
The average building cost across New South Wales showed substantial variation during FY26. Premium Sydney markets remained among the most expensive locations, with St Ives averaging $1,190,636, Dural – Kenthurst – Wisemans Ferry at $1,106,673, and North Kellyville at $1,003,785. Other high-cost areas included Pymble at $972,863, Kingscliff – Fingal Head at $879,862, and Yass Surrounds at $860,430. Some of the strongest increases occurred outside these highest-cost locations, with Lake Munmorah – Mannering Park rising by 49.01% to $329,799, Mudgee by 35.55% to $613,677, Orange Surrounds by 35.29% to $695,976, and Picton – Tahmoor – Buxton by 32.21% to $448,004. Conversely, substantial cost declines were recorded in Forster-Tuncurry Surrounds (-50.17%), Avoca Beach – Copacabana (-49.05%), Stockton – Fullerton Cove (-42.73%), Singleton (-42.68%), and Taree (-31.70%).
Notable SA2 Regions:
Austral – Greendale and Box Hill – Nelson emerged as the largest contributors to new house approvals, reinforcing the importance of Sydney's south-western and north-western growth corridors. Douglas Park – Appin and Leppington – Catherine Field also recorded substantial volumes, while Schofields – East stood out with a 124.11% increase to 316 approvals. Regional and coastal markets also recorded significant growth, including Morisset – Cooranbong, Albion Park – Macquarie Pass and Maclean – Yamba – Iluka. At the higher end of the market, St Ives, Dural – Kenthurst – Wisemans Ferry, North Kellyville and Pymble recorded some of the state's highest average building costs, highlighting the continued premium associated with construction in established Sydney markets.
High-Increase Areas:
The most dramatic rises in approvals occurred across a mixture of coastal, regional and lower-volume markets. Anna Bay recorded an exceptional 2,437.50% increase to 203 approvals, while Lake Munmorah – Mannering Park surged by 2,466.67% to 154 approvals. Stockton – Fullerton Cove increased by 569.23% to 87 approvals, Dubbo – East rose by 466.67% to 51, and Forster-Tuncurry Surrounds increased by 302.50% to 161. Singleton also rose by 300.00% to 64 approvals, while Nambucca Heads increased by 265.38% to 95 and Wentworth – Buronga by 212.50% to 125. These results highlight rapid growth from comparatively low previous-year bases and demonstrate the expansion of new housing activity beyond Sydney's established growth corridors.
Areas with Notable Cost Increases:
Several areas recorded striking increases in average building costs during FY26. Lake Munmorah – Mannering Park rose by 49.01% to $329,799, while Mudgee increased by 35.55% to $613,677 and Orange Surrounds by 35.29% to $695,976. Picton – Tahmoor – Buxton climbed 32.21% to $448,004, Smithfield – Wetherill Park rose 30.98% to $365,106, and Hoxton Park – Carnes Hill – Horningsea Park increased by 25.52% to $483,552. Kurri Kurri – Abermain also rose by 24.61% to $343,088, Dungog increased by 23.88% to $588,621, and Warragamba – Silverdale grew by 23.01% to $534,794. These results indicate rising construction costs across Sydney's growth areas as well as regional and lifestyle markets.
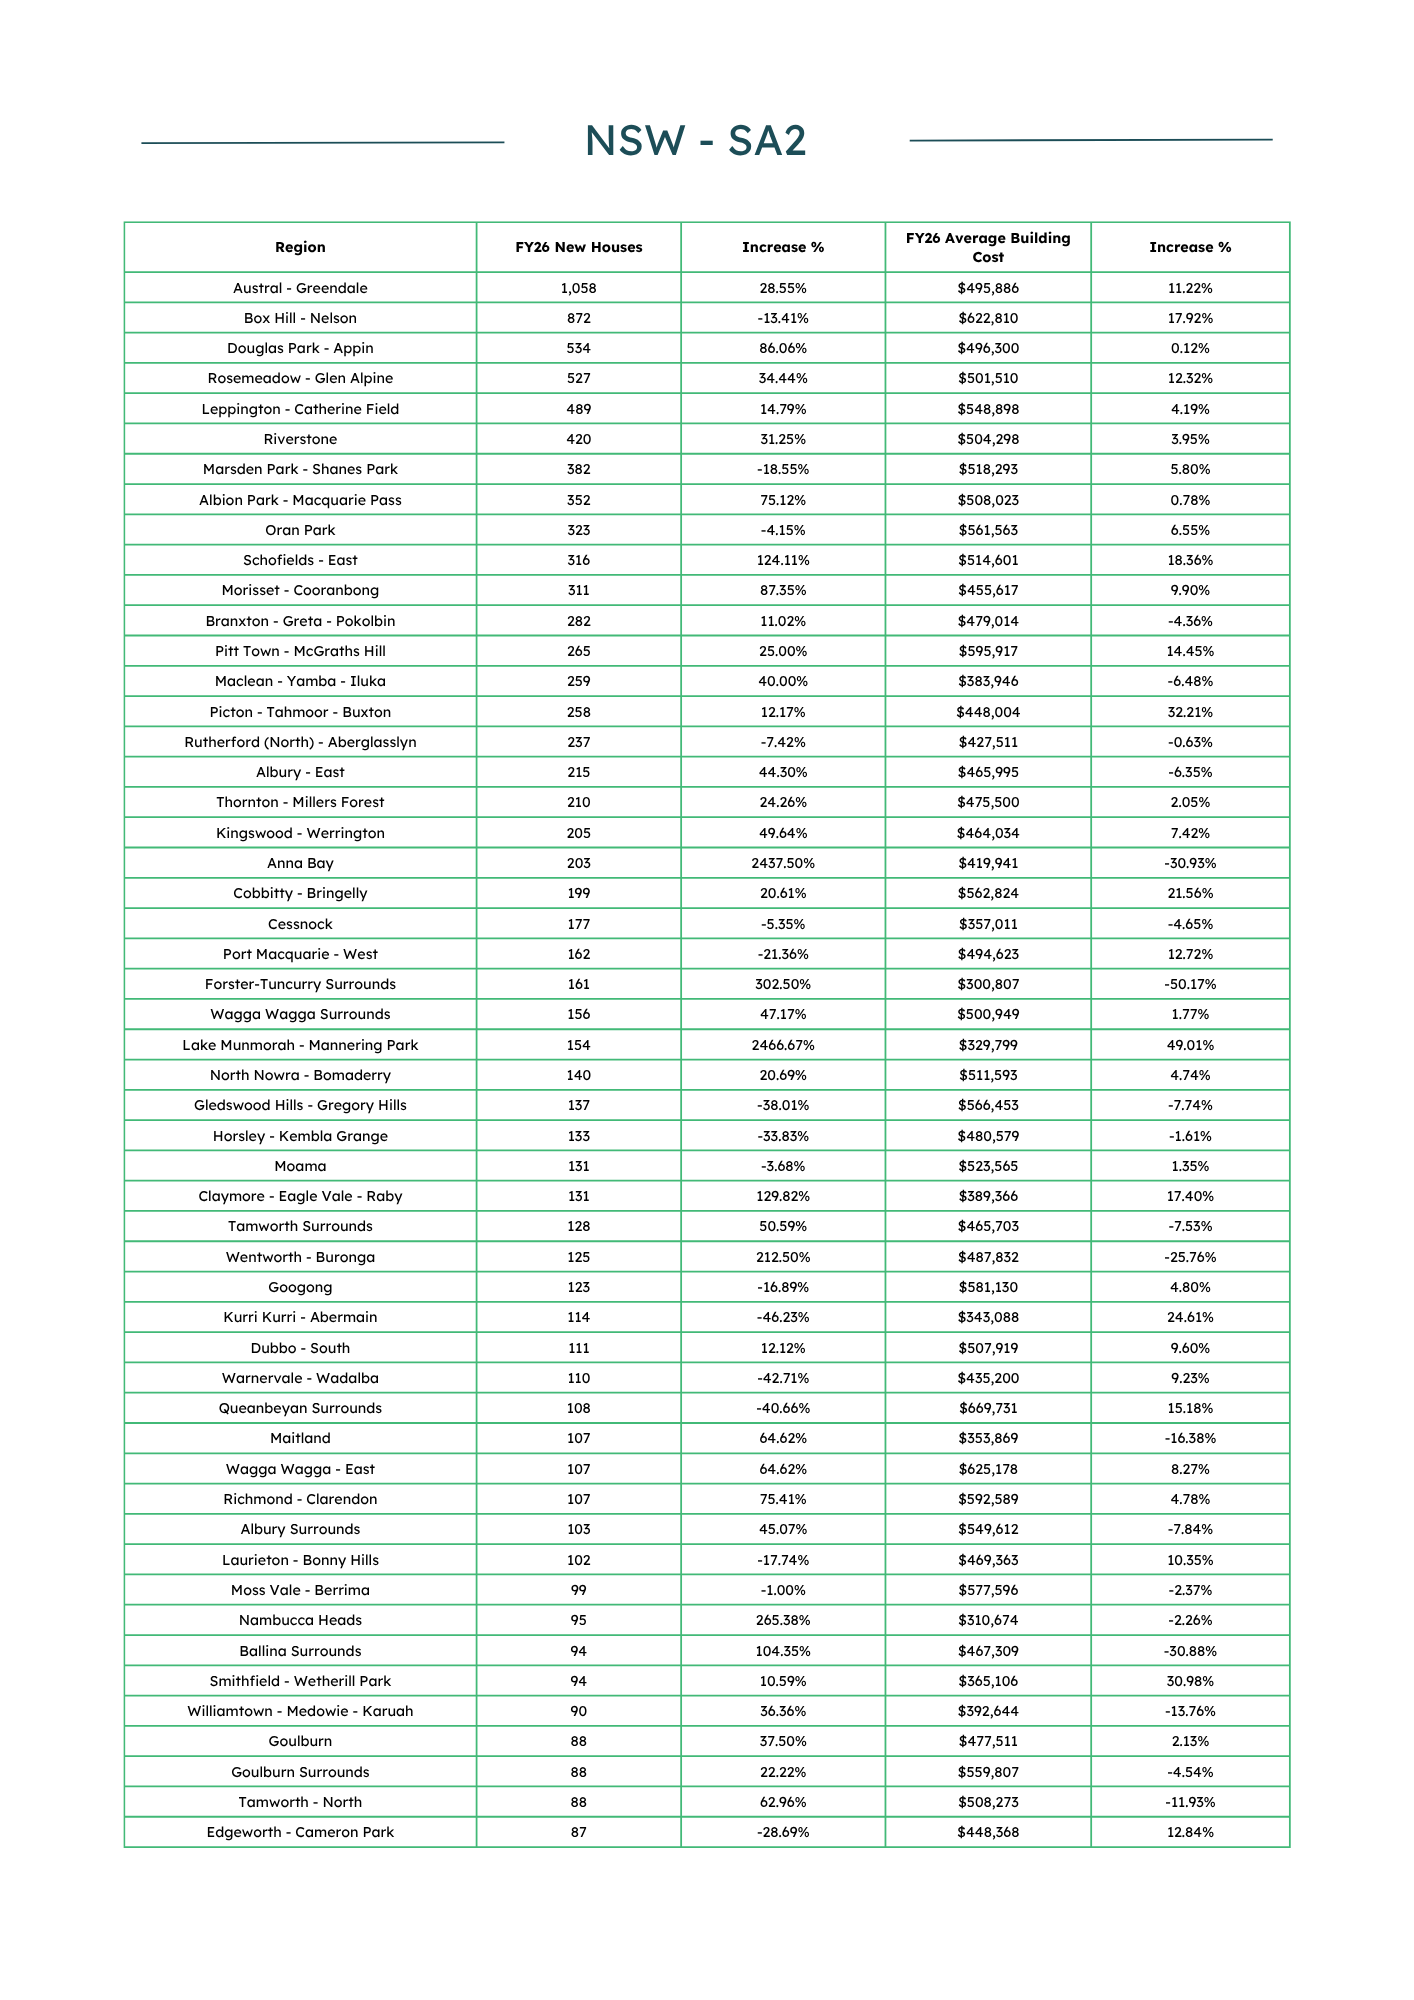
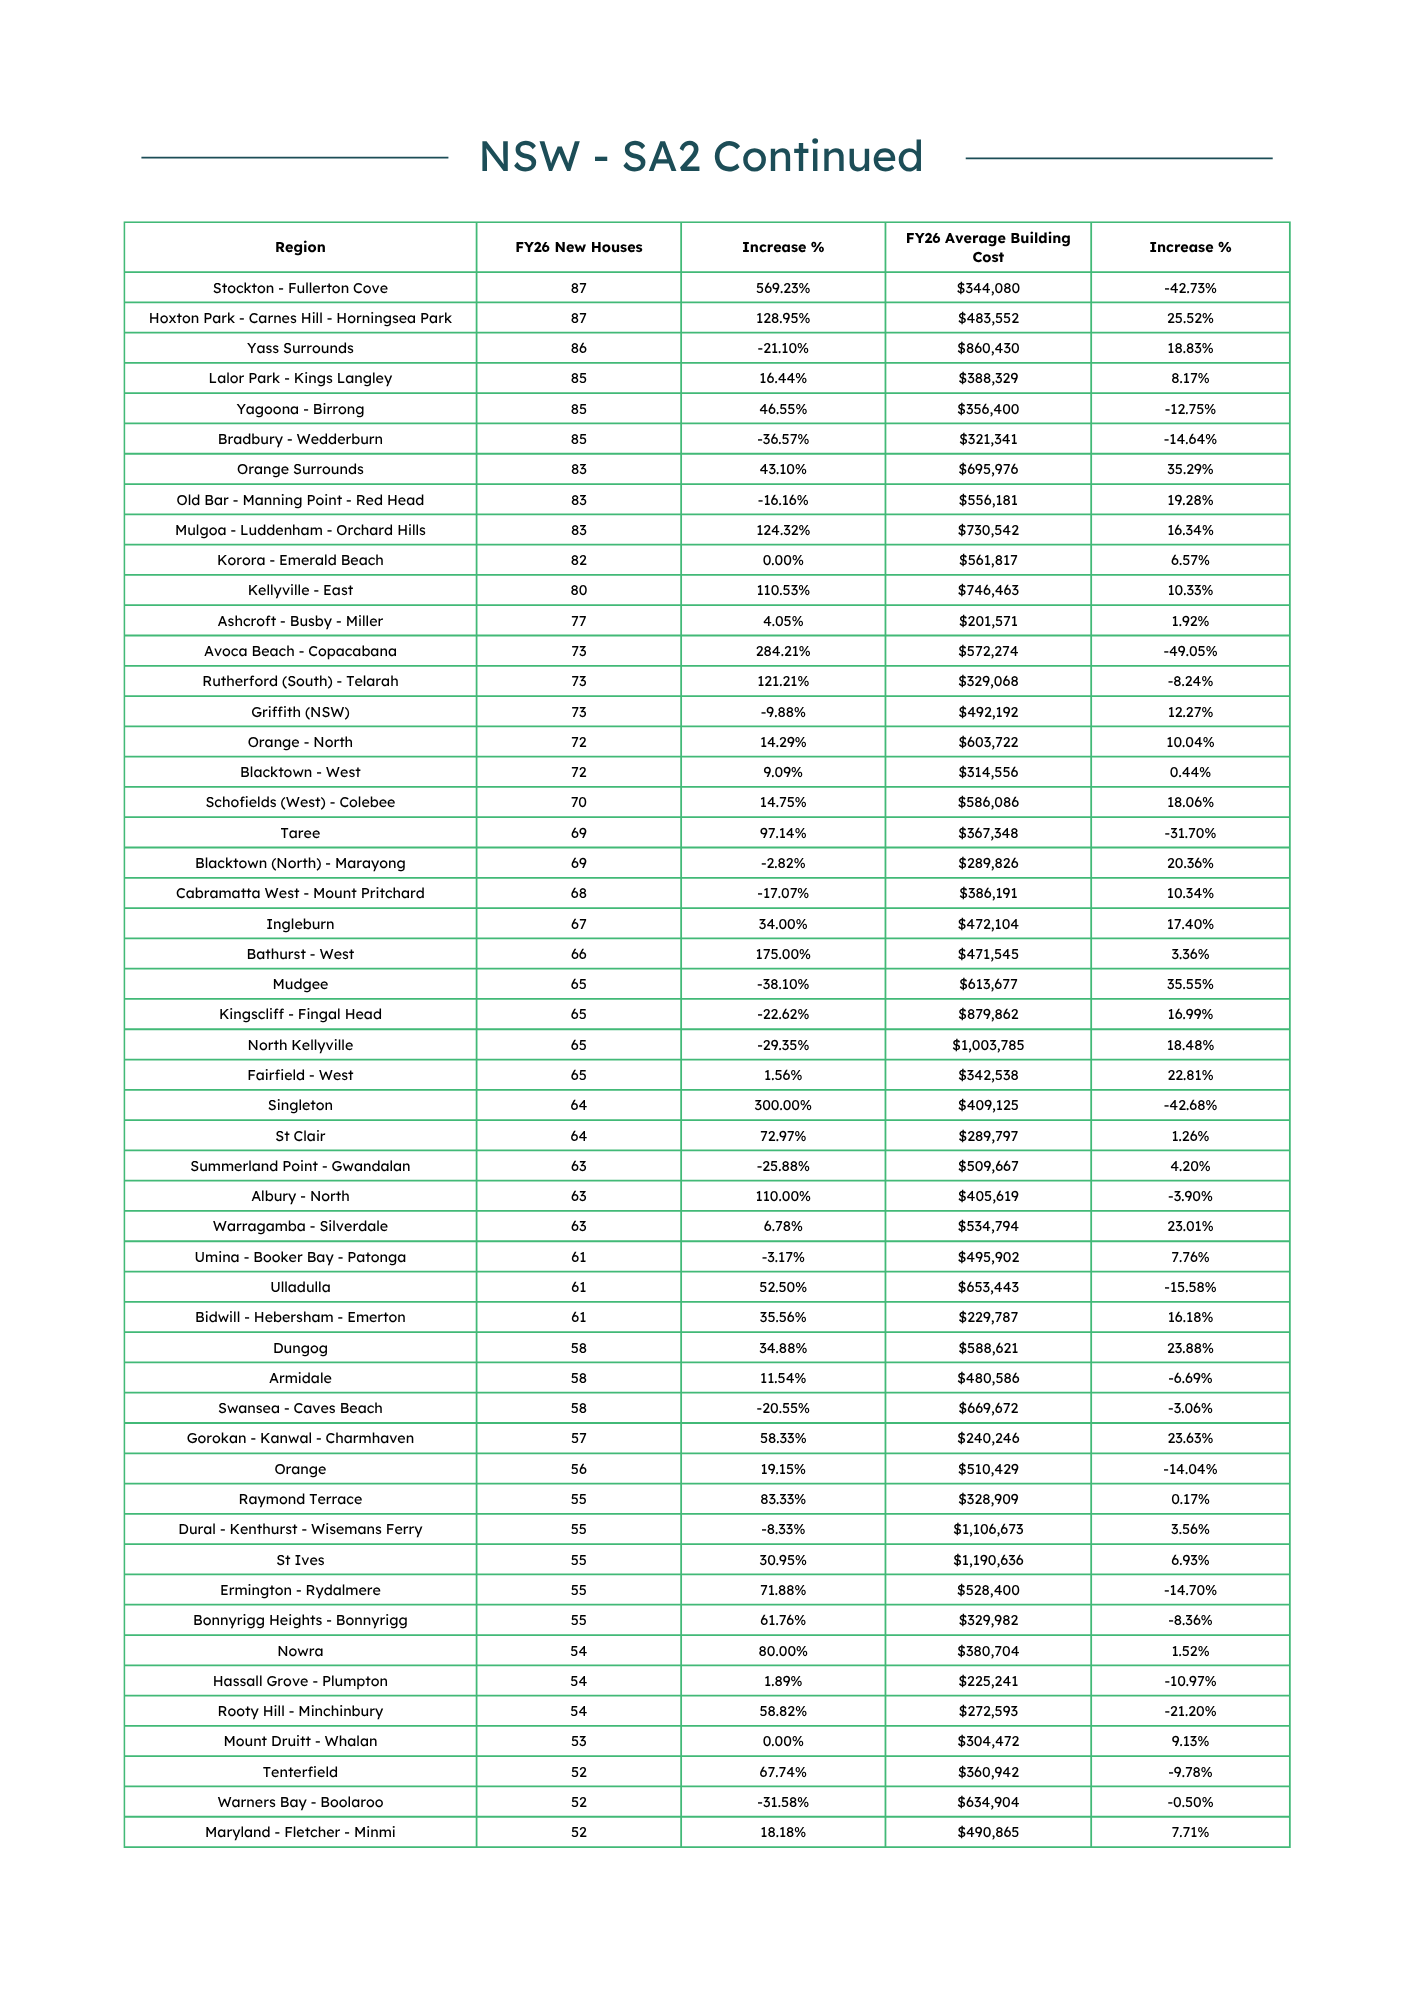
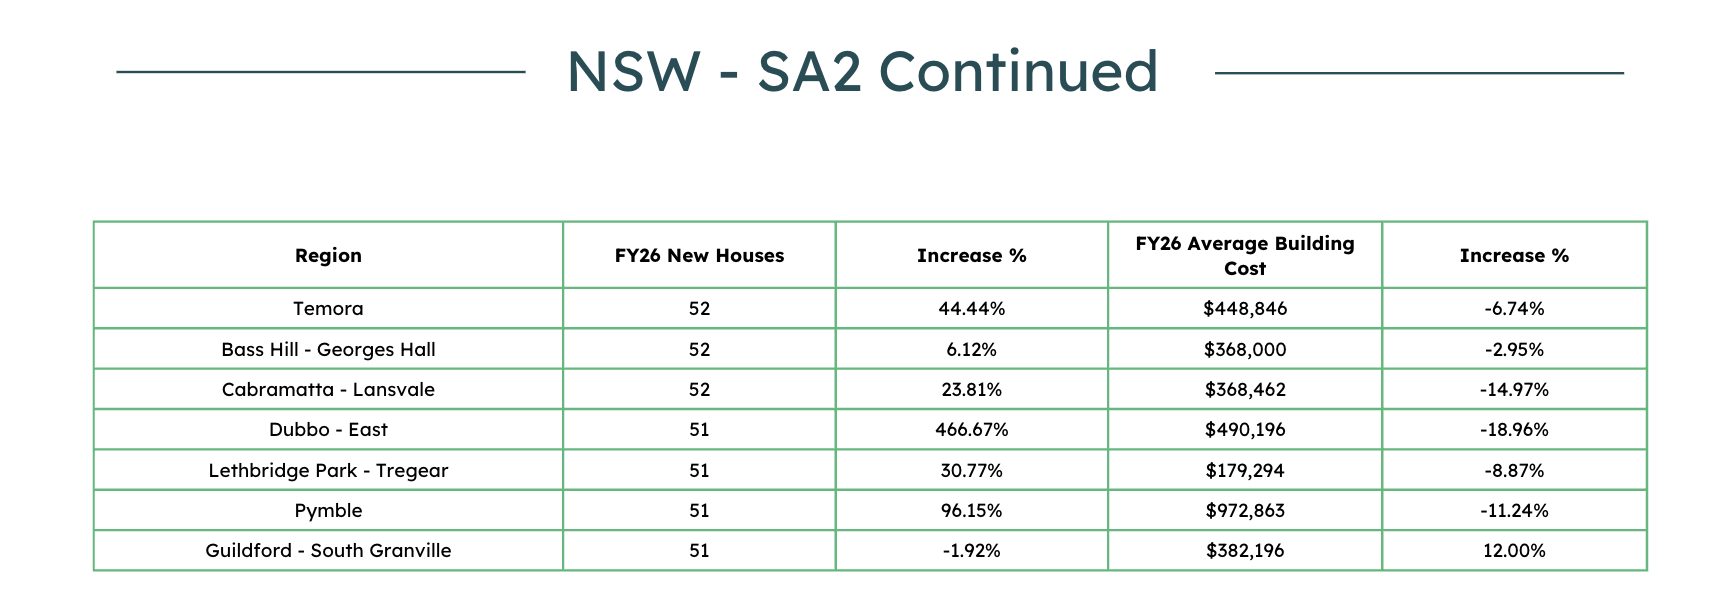
In New South Wales during FY26, new house approvals showed strong but uneven growth, with Austral – Greendale leading the state at 1,058 approvals after increasing by 28.55%, while Douglas Park – Appin rose by 86.06% to 534 and Schofields – East increased by 124.11% to 316. Regional and coastal markets also recorded exceptional percentage growth, including Lake Munmorah – Mannering Park, Anna Bay, Stockton – Fullerton Cove and Forster-Tuncurry Surrounds, although several of these increases came from comparatively low previous-year bases. Conversely, declines were evident in areas such as Kurri Kurri – Abermain, Warnervale – Wadalba and Queanbeyan Surrounds. Average building costs also varied considerably, with premium Sydney areas such as St Ives, Dural – Kenthurst – Wisemans Ferry and North Kellyville exceeding $1 million, while Lake Munmorah – Mannering Park, Mudgee and Orange Surrounds recorded some of the strongest cost increases. This dynamic suggests a shifting housing landscape across New South Wales, with major Sydney growth corridors maintaining high approval volumes while regional and coastal markets experience significant changes in both new housing activity and building costs.

This report delves into the housing data for Victoria, focusing on Small Area 2 (SA2) regions. The data encompasses the number of new houses approved and the average building cost in each SA2 area during FY26.
Key Findings
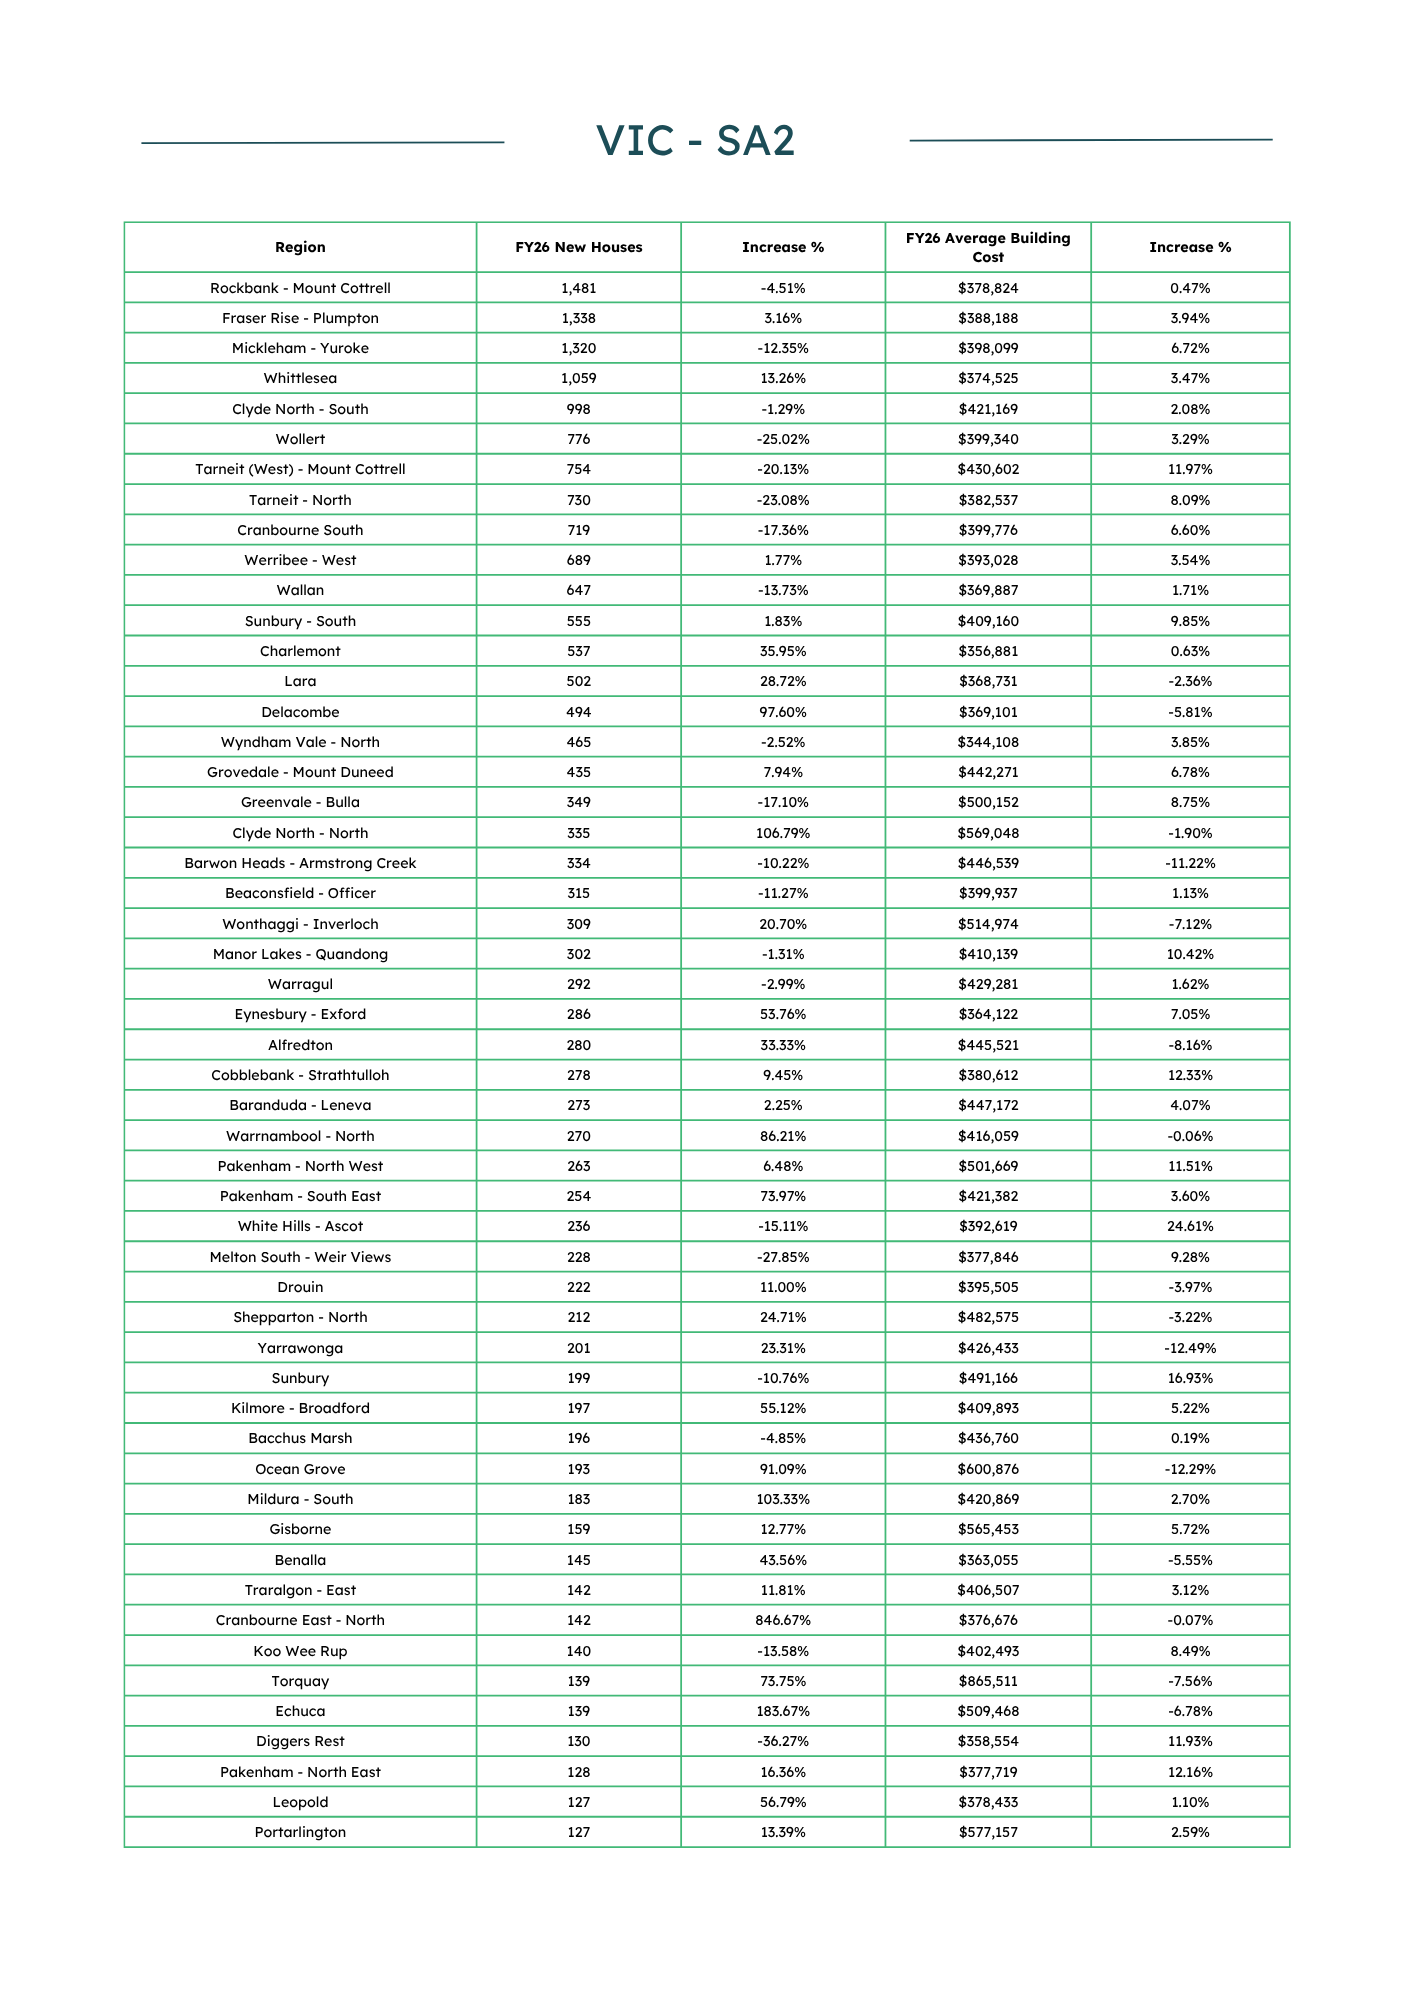
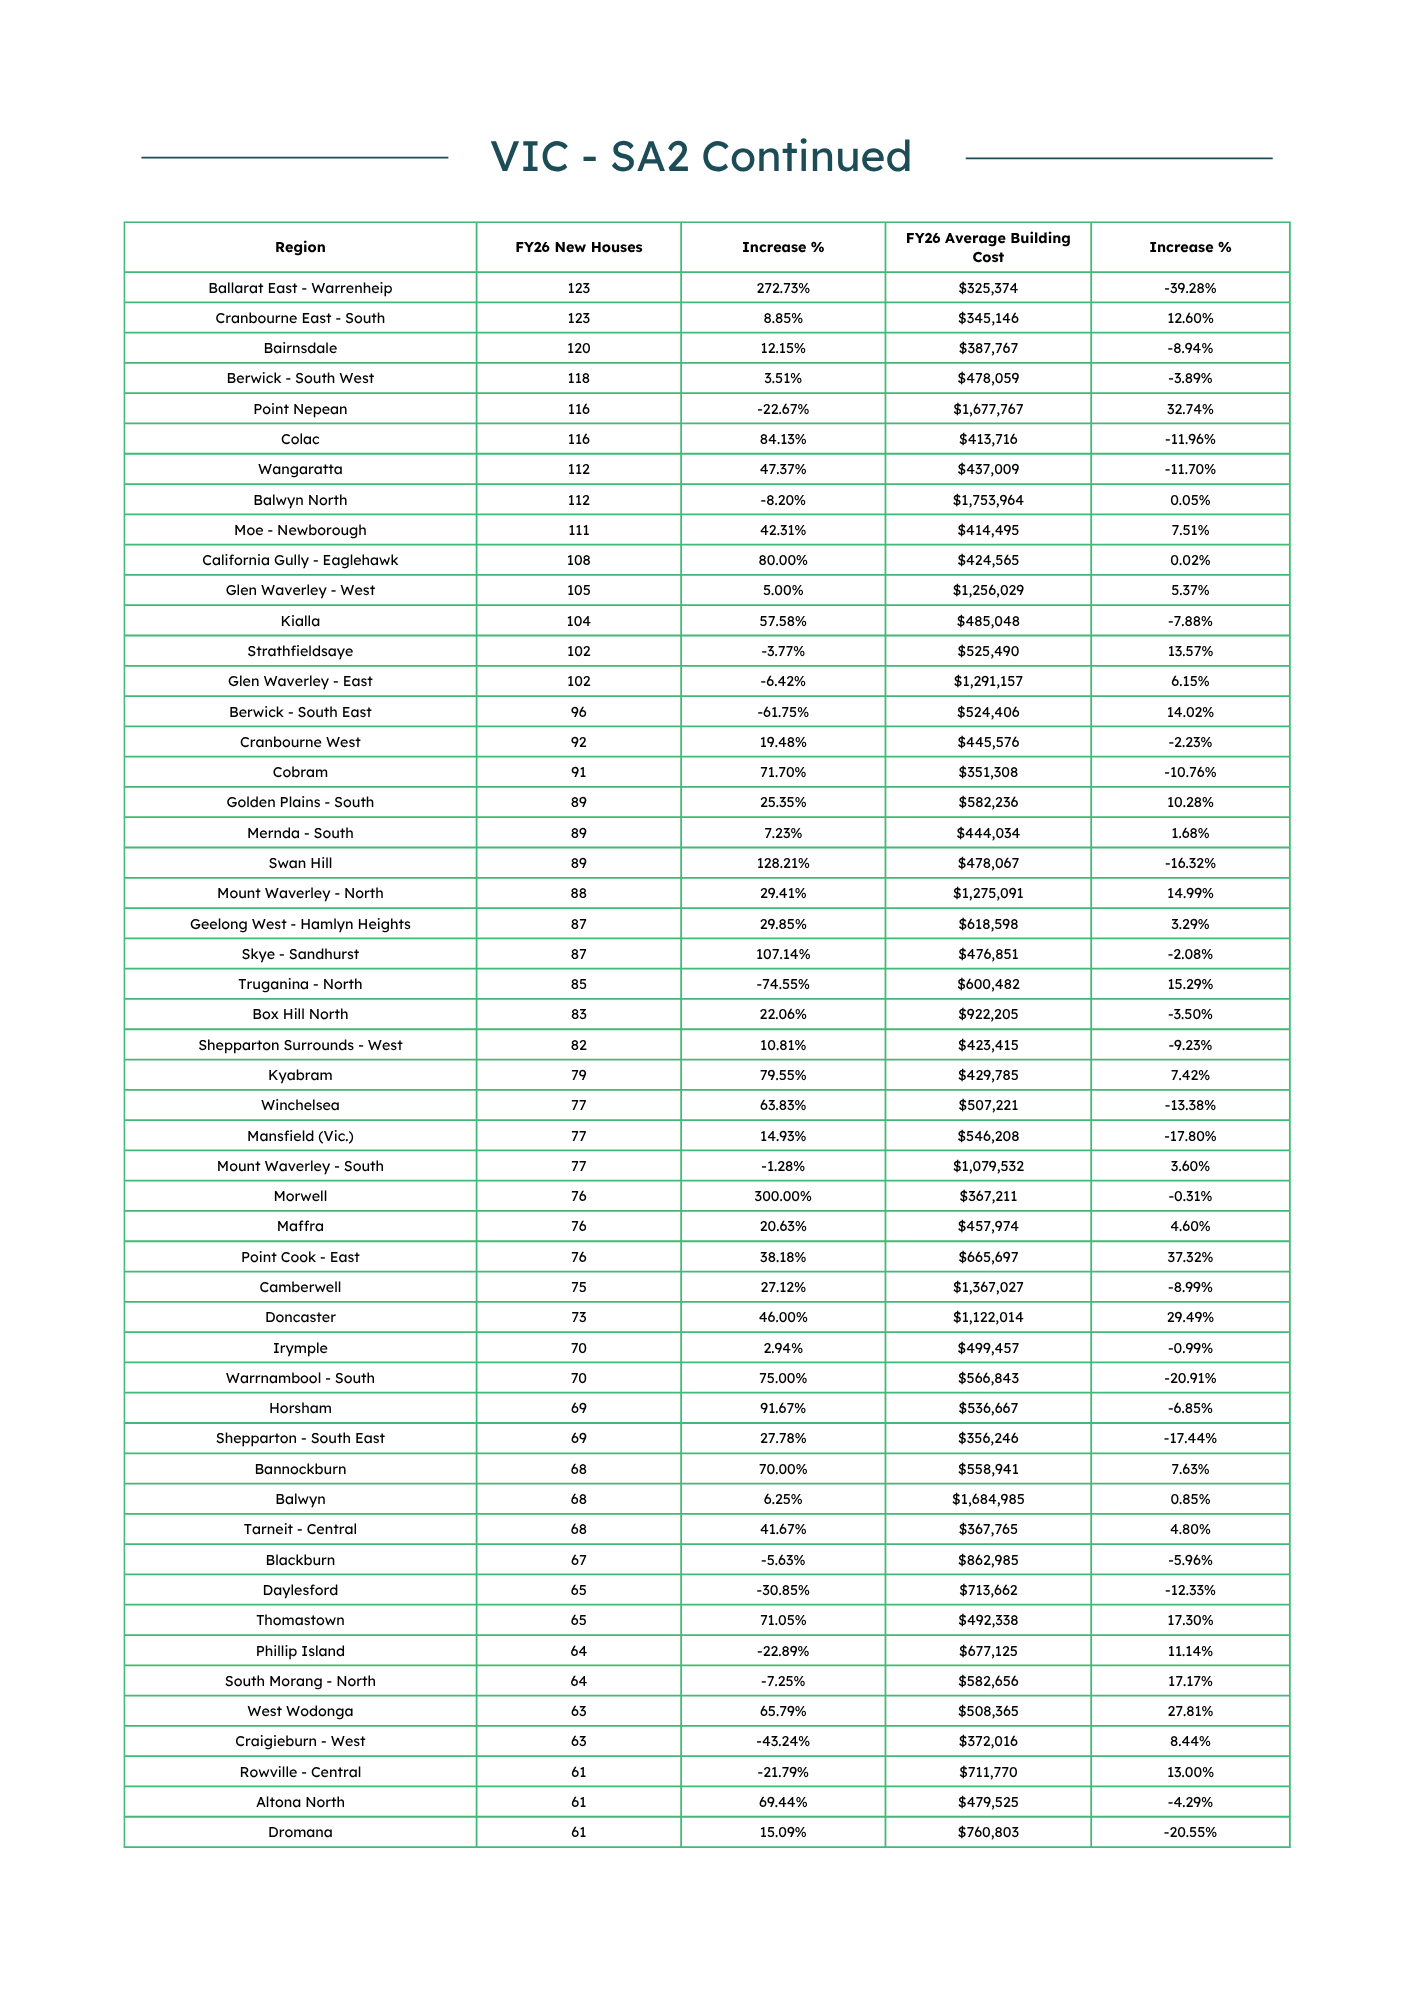
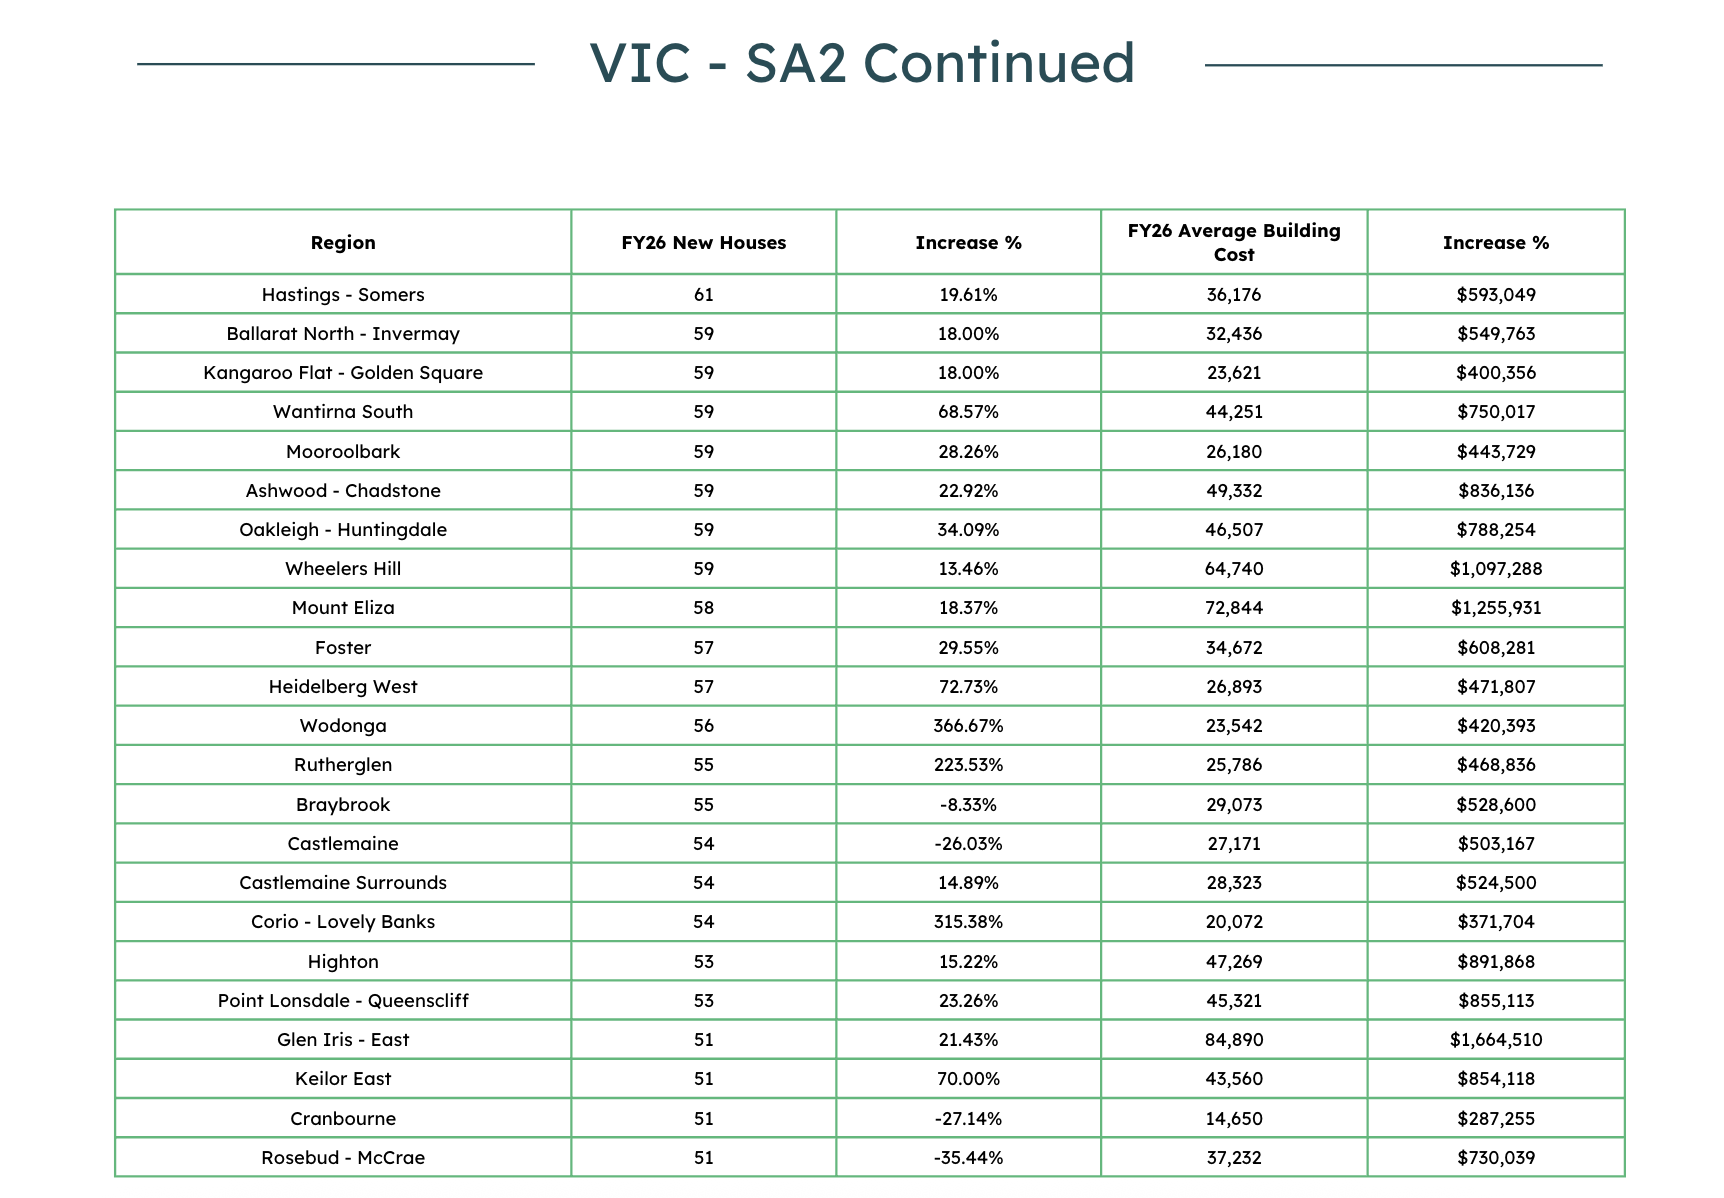
Victoria's housing market delivered varied outcomes during FY26, with Melbourne's western and northern growth corridors continuing to dominate new house approvals despite softer activity across several established greenfield areas. Rockbank – Mount Cottrell remained the state's largest approval market with 1,481 new houses, while Fraser Rise – Plumpton and Whittlesea also recorded strong activity. Significant approval growth was evident in emerging regional centres such as Delacombe, Warrnambool – North, Ocean Grove and Mildura – South, alongside rapidly expanding metropolitan areas including Clyde North – North. Average building costs continued to rise across much of the state, with Point Nepean ($1,677,767), Balwyn North ($1,753,964) and Balwyn ($1,684,985) remaining among Victoria's most expensive locations to build. Strong cost increases in areas such as Point Cook – East, Rosebud – McCrae and Doncaster further reflect ongoing construction cost pressures. Overall, the FY26 data indicates a housing market characterised by continued expansion across key growth corridors, accelerating activity in selected regional centres and sustained high building costs across Victoria's premium residential markets.

This report delves into the housing data for Queensland, focusing on Small Area 2 (SA2) regions. The data encompasses the number of new houses and the average building cost in each SA2 area.
Key Findings
New House Approvals:
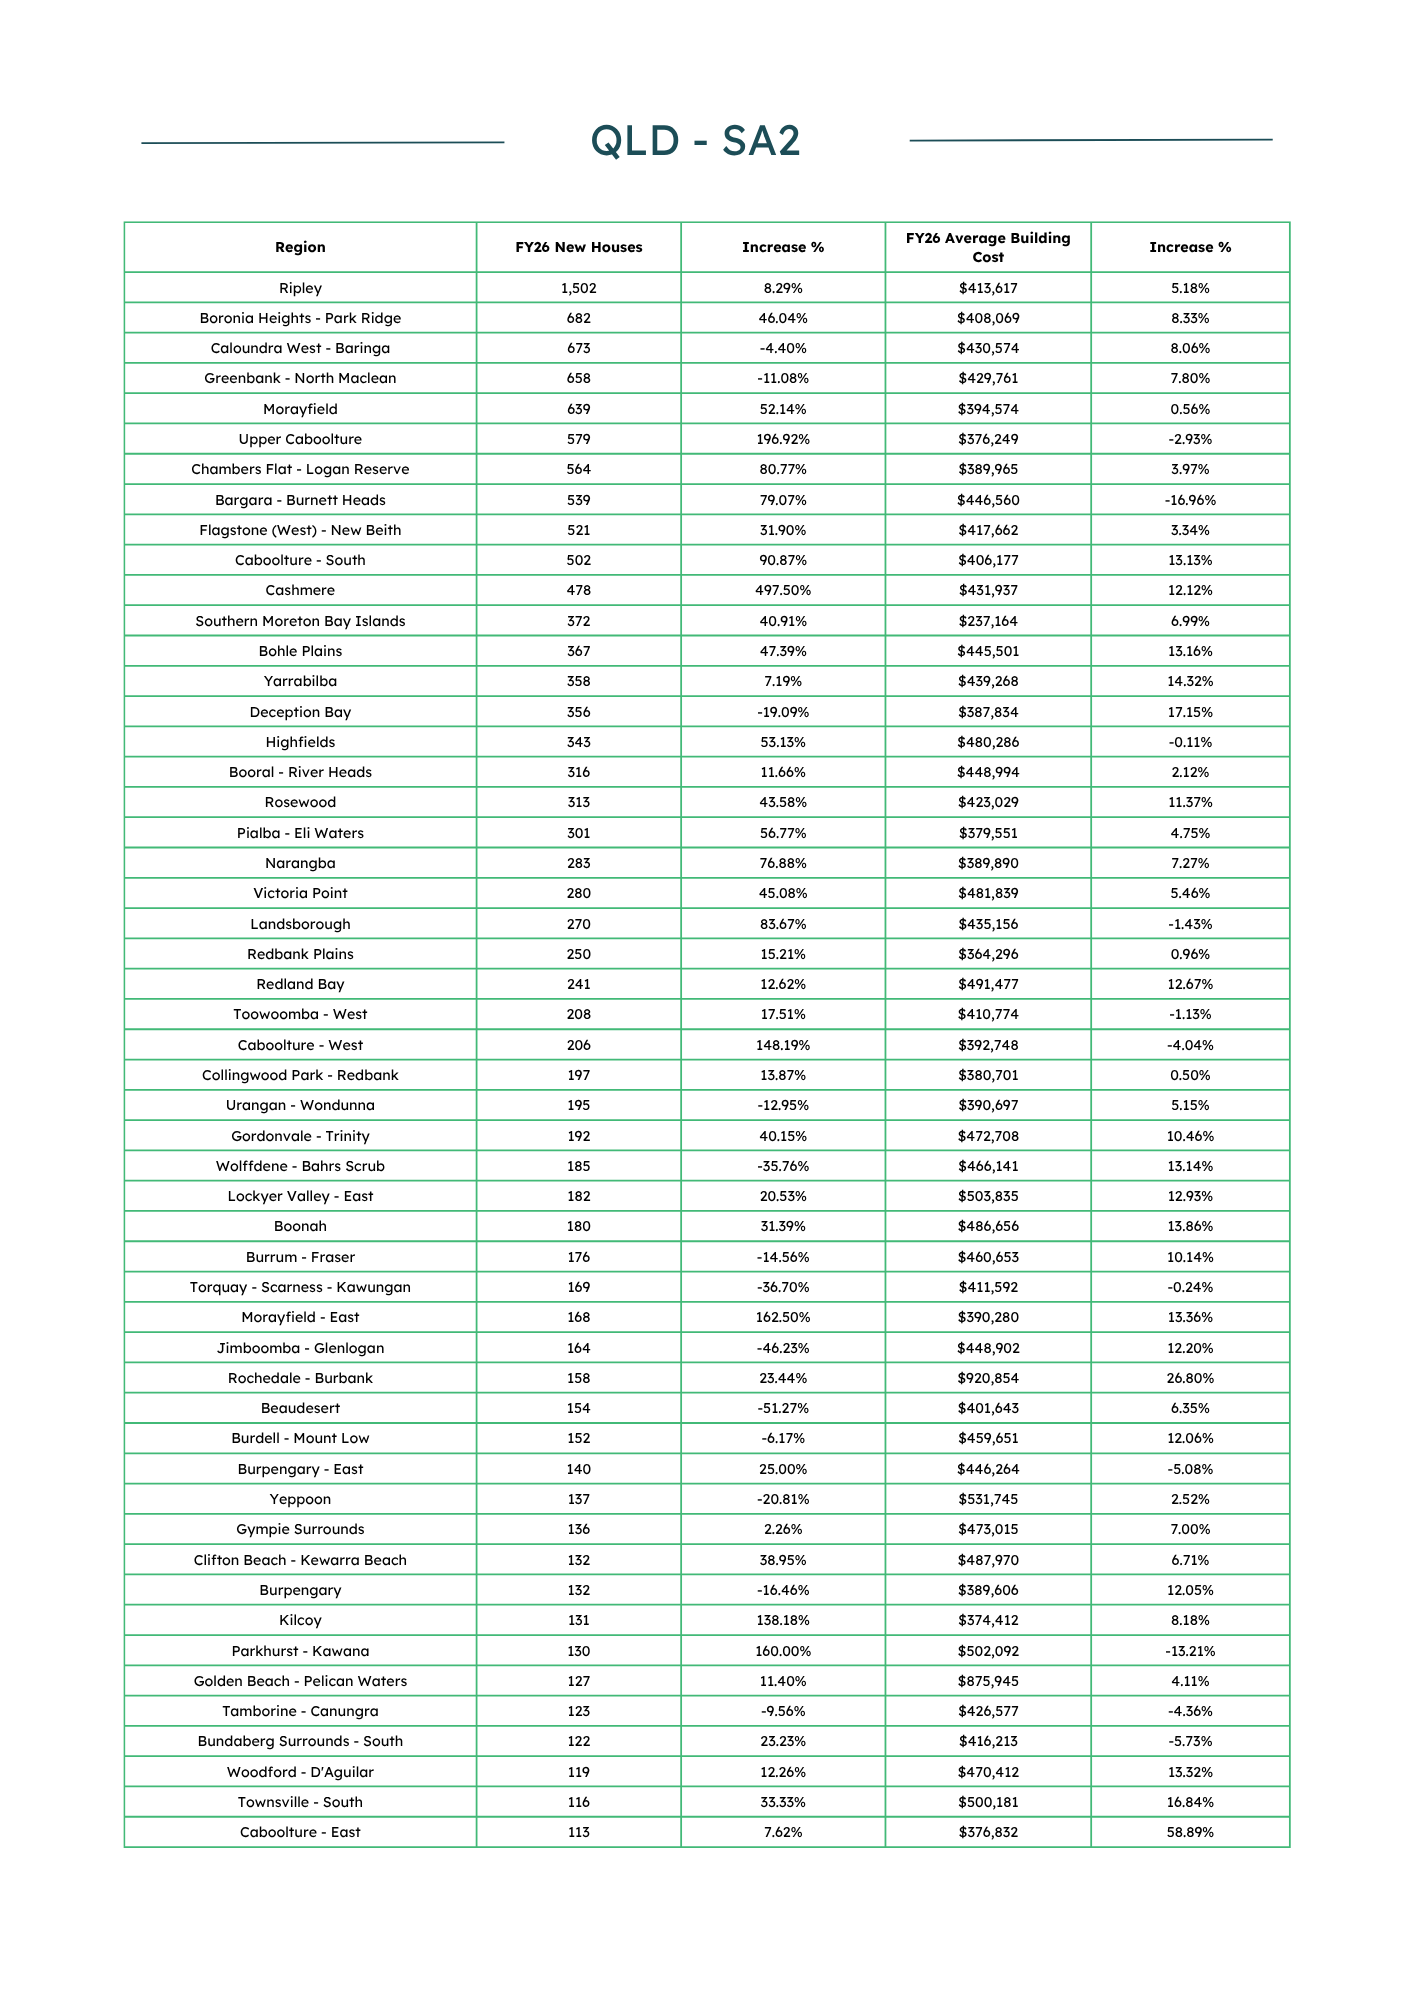
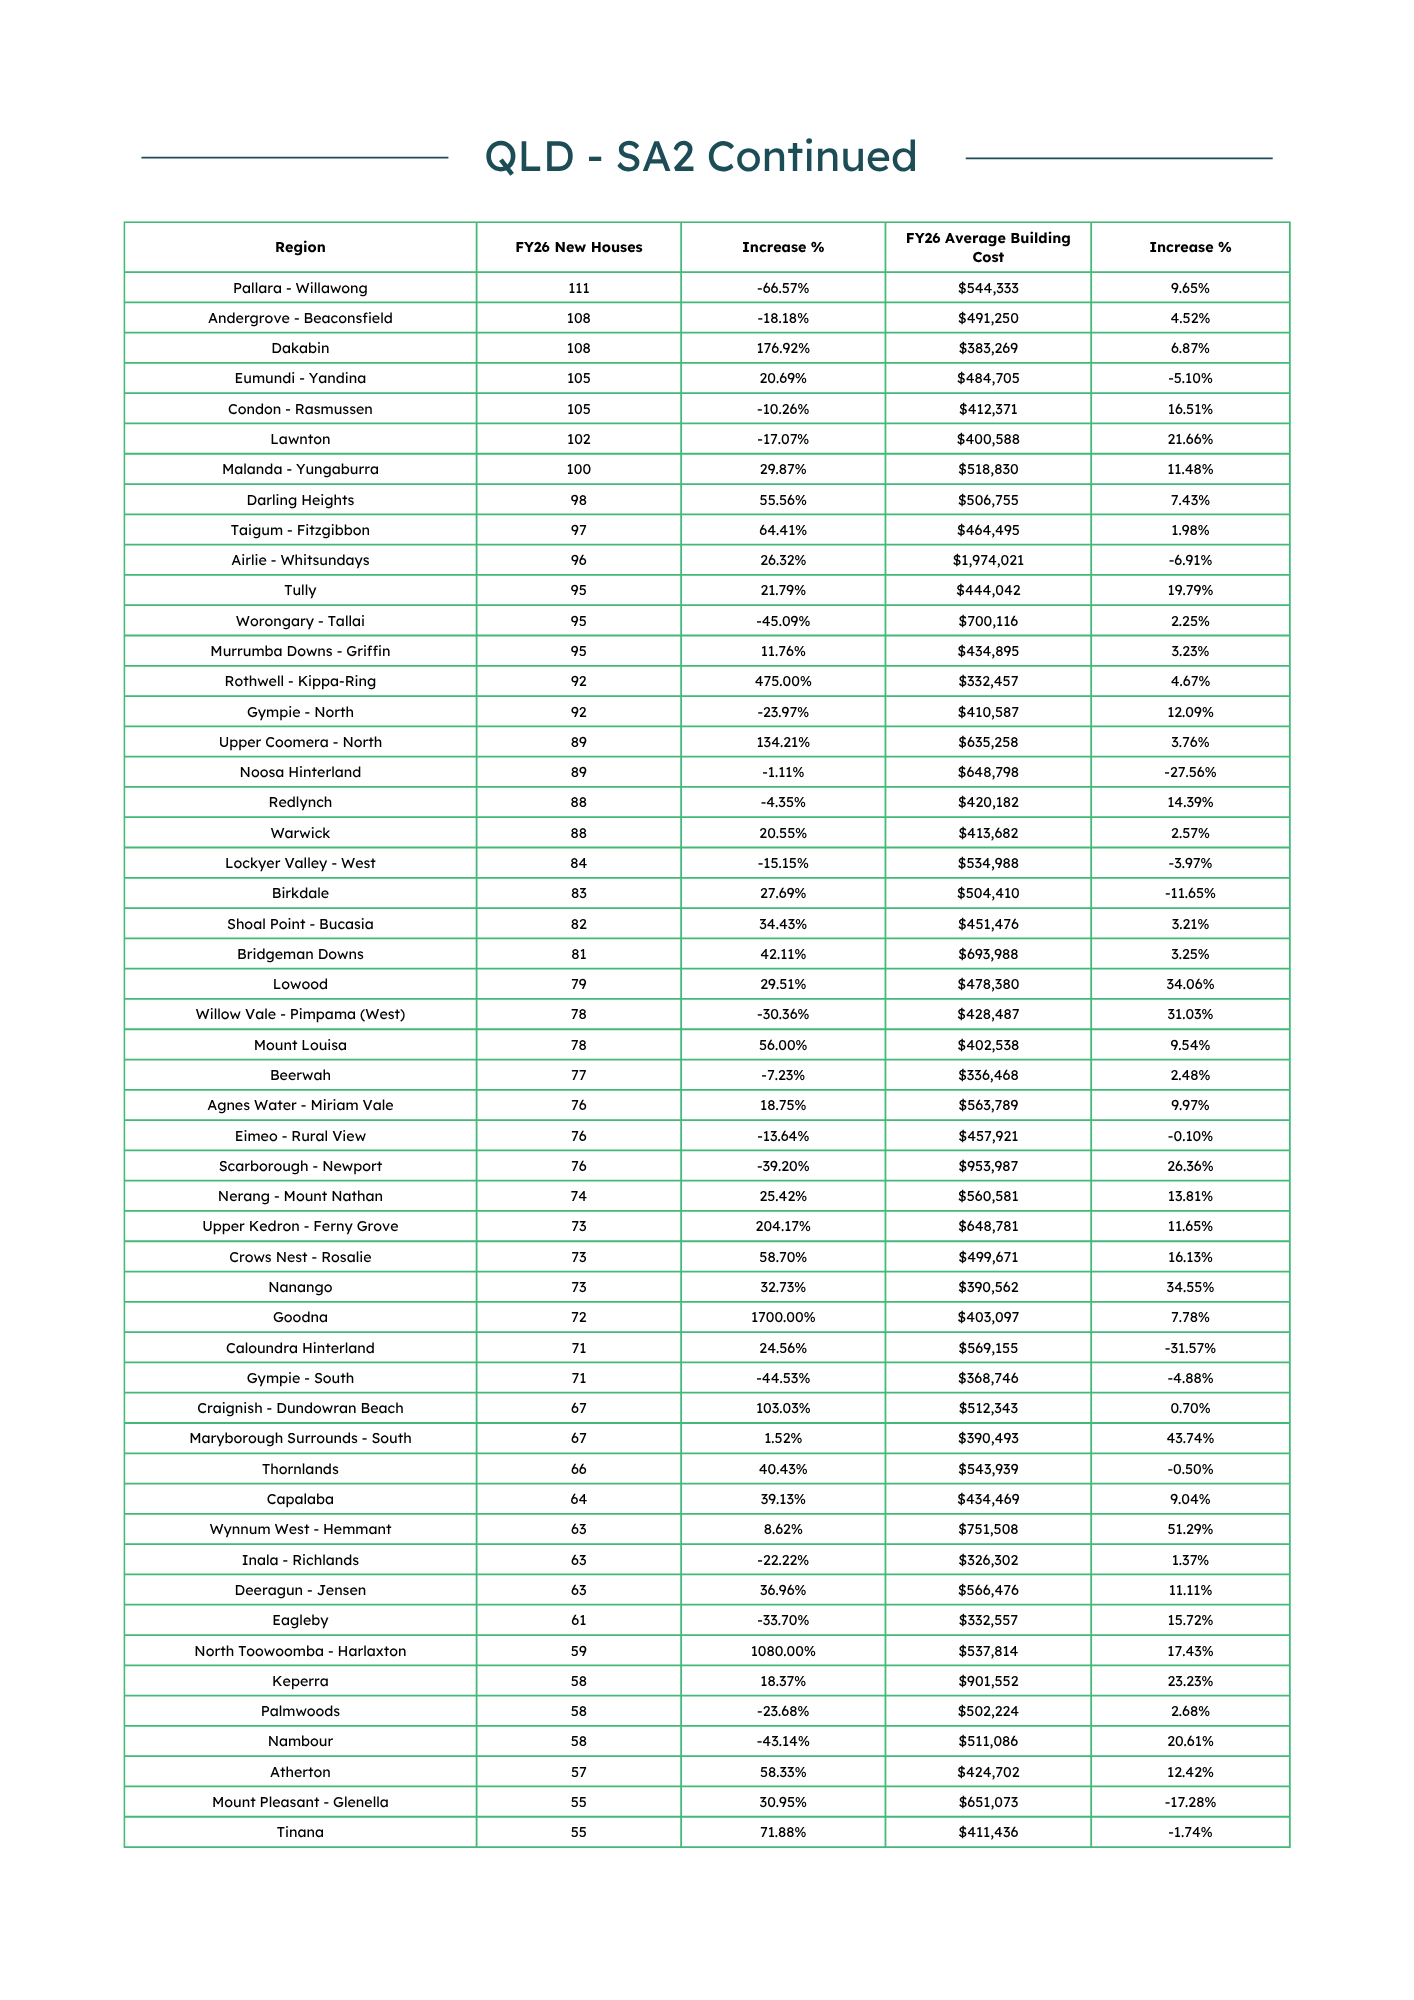
In Queensland, new house approvals showed strong but uneven growth across regions in FY26, with substantial activity concentrated in South East Queensland alongside notable expansion in regional markets. Ripley recorded the highest volume with 1,502 new houses, increasing by 8.29%, while Boronia Heights – Park Ridge rose by 46.04% to 682. Caloundra West – Baringa recorded 673 new houses despite a 4.40% decline, while Greenbank – North Maclean fell by 11.08% to 658. Morayfield increased strongly by 52.14% to 639, Upper Caboolture surged by 196.92% to 579, and Chambers Flat – Logan Reserve rose by 80.77% to 564. Other significant increases included Cashmere, up 497.50% to 478, Caboolture – South, up 90.87% to 502, and Bargara – Burnett Heads, up 79.07% to 539. In contrast, Pallara – Willawong declined by 66.57% to 111 new houses, Beaudesert fell by 51.27% to 154, Jimboomba – Glenlogan declined by 46.23% to 164, and Worongary – Tallai fell by 45.09% to 95.
Average Building Costs:
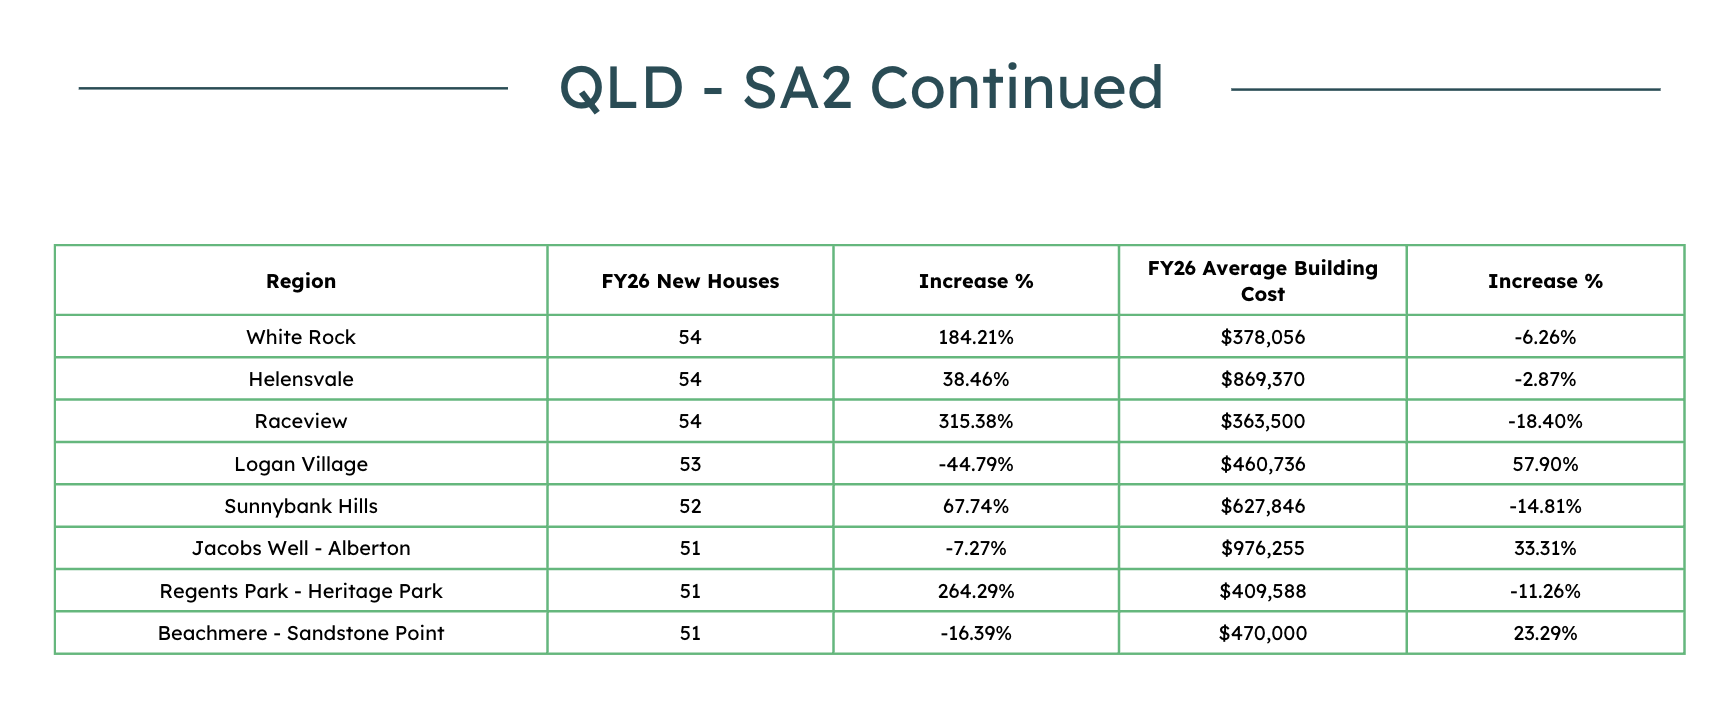
Average building costs varied considerably across Queensland during FY26, with premium coastal and metropolitan locations recording some of the highest values. Airlie – Whitsundays recorded the highest average building cost in the supplied data at $1,974,021 despite a 6.91% decline. Jacobs Well – Alberton averaged $976,255 following a 33.31% increase, while Scarborough – Newport reached $953,987 after rising by 26.36%. Rochedale – Burbank recorded $920,854, up 26.80%, and Keperra averaged $901,552 following a 23.23% increase. Significant percentage increases were also recorded in Caboolture – East, up 58.89% to $376,832, Logan Village, up 57.90% to $460,736, and Wynnum West – Hemmant, up 51.29% to $751,508. Conversely, notable declines occurred in Caloundra Hinterland (-31.57%), Noosa Hinterland (-27.56%), Raceview (-18.40%), Mount Pleasant – Glenella (-17.28%) and Bargara – Burnett Heads (-16.96%).
Notable SA2 Regions:
Ripley remained the largest contributor to new housing activity, reinforcing the strength of the Ipswich growth corridor, while Boronia Heights – Park Ridge, Greenbank – North Maclean and Chambers Flat – Logan Reserve highlighted continued development across the Logan and southern Brisbane growth areas. The Moreton Bay region also featured prominently, with Morayfield, Upper Caboolture and Caboolture – South recording substantial volumes and strong growth. Bargara – Burnett Heads demonstrated significant regional activity with 539 new houses, while Cashmere stood out for its rapid 497.50% increase. At the higher end of the market, Airlie – Whitsundays, Jacobs Well – Alberton, Scarborough – Newport, Rochedale – Burbank and Keperra recorded some of the highest average building costs in the supplied Queensland data.
High-Increase Areas:
The most dramatic increases in new houses occurred across a mixture of metropolitan fringe and regional markets. Goodna recorded an exceptional 1,700.00% increase to 72 new houses, while North Toowoomba – Harlaxton rose by 1,080.00% to 59. Cashmere increased by 497.50% to 478 new houses, Rothwell – Kippa-Ring rose by 475.00% to 92, and Raceview climbed by 315.38% to 54. Regents Park – Heritage Park increased by 264.29% to 51, Upper Kedron – Ferny Grove rose by 204.17% to 73, and Upper Caboolture increased by 196.92% to 579. Other notable rises included White Rock (+184.21%), Dakabin (+176.92%), Morayfield – East (+162.50%), Parkhurst – Kawana (+160.00%) and Caboolture – West (+148.19%). These results highlight strong expansion across Queensland's outer metropolitan and regional markets, although the largest percentage increases in lower-volume areas are likely to reflect comparatively small previous-year bases.
Areas with Notable Cost Increases:
Several Queensland SA2 regions recorded substantial increases in average building costs during FY26. Caboolture – East experienced the largest increase in the supplied data, rising by 58.89% to $376,832, while Logan Village climbed by 57.90% to $460,736. Wynnum West – Hemmant increased by 51.29% to $751,508, and Maryborough Surrounds – South rose by 43.74% to $390,493. Nanango recorded a 34.55% increase to $390,562, Lowood rose by 34.06% to $478,380, and Jacobs Well – Alberton increased by 33.31% to $976,255. Other significant increases were recorded in Willow Vale – Pimpama (West), up 31.03% to $428,487, Rochedale – Burbank, up 26.80% to $920,854, and Scarborough – Newport, up 26.36% to $953,987. These results demonstrate increasing construction costs across a broad mix of Brisbane, coastal, growth-corridor and regional locations.

This report delves into the housing data for South Australia, focusing on Small Area 2 (SA2) regions. The data encompasses the number of new houses and the average building cost in each SA2 area.
Key Findings
New House Approvals:
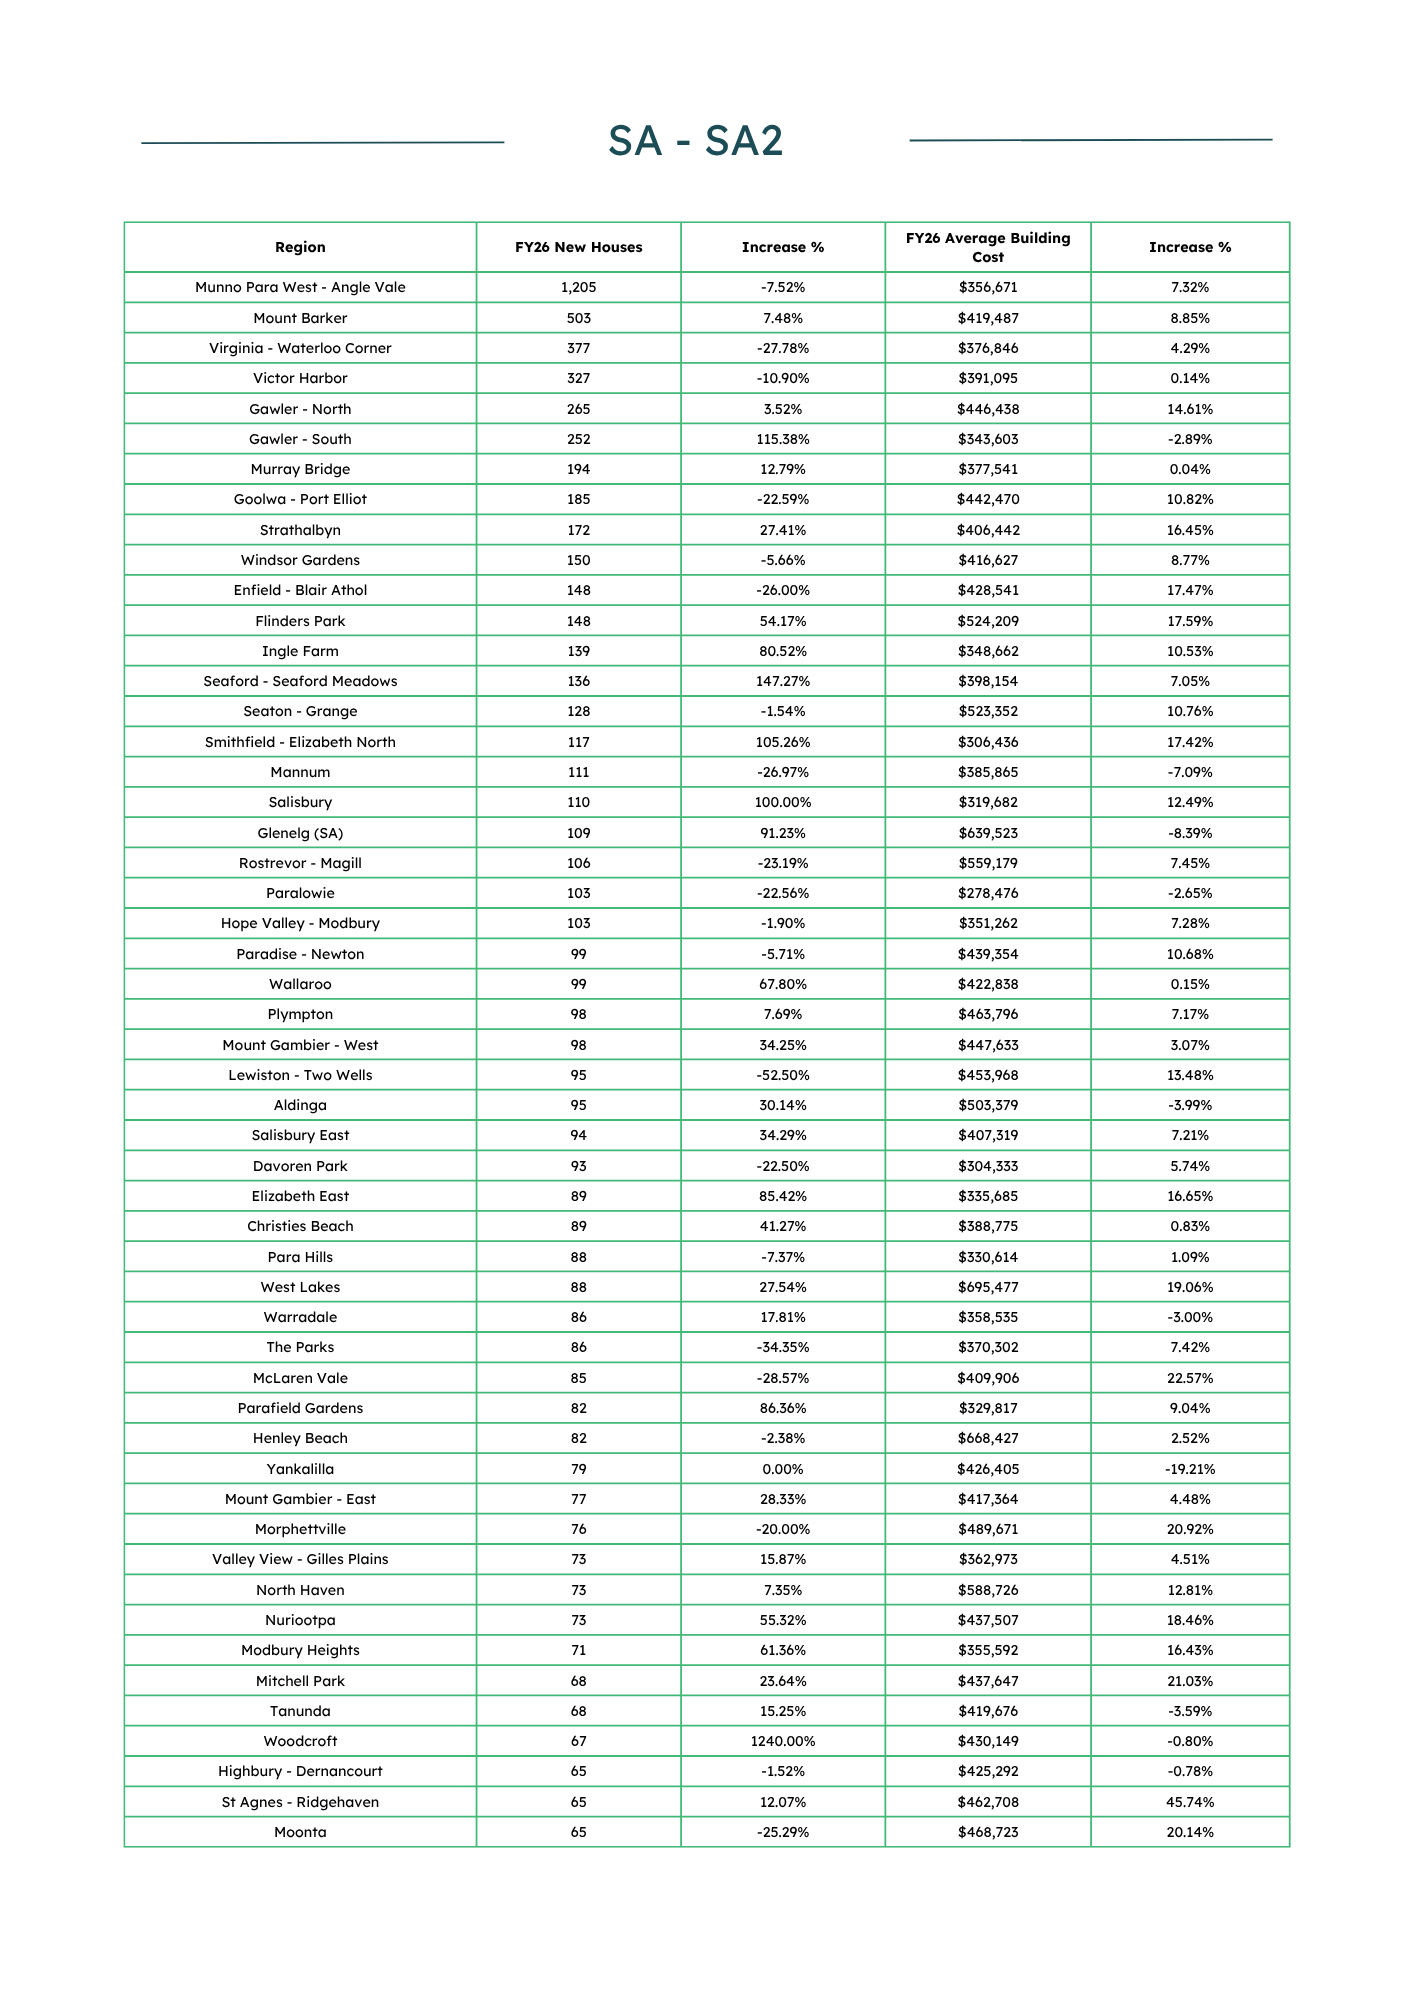
In South Australia, new house activity shifted unevenly across regions in FY26, with strong growth in several metropolitan and regional markets alongside declines in some established areas. Munno Para West – Angle Vale recorded the highest volume with 1,205 new houses, despite a 7.52% decline, while Mount Barker increased by 7.48% to 503. Virginia – Waterloo Corner remained a major contributor with 377 new houses, although activity fell by 27.78%, while Victor Harbor declined by 10.90% to 327. Strong growth was recorded in Gawler – South, up 115.38% to 252 new houses, Seaford – Seaford Meadows, up 147.27% to 136, Smithfield – Elizabeth North, up 105.26% to 117, and Salisbury, which doubled with a 100.00% increase to 110. In contrast, Northgate – Northfield declined by 59.03% to 59 new houses, Lewiston – Two Wells fell by 52.50% to 95, The Parks declined by 34.35% to 86, and McLaren Vale fell by 28.57% to 85.
Average Building Costs:
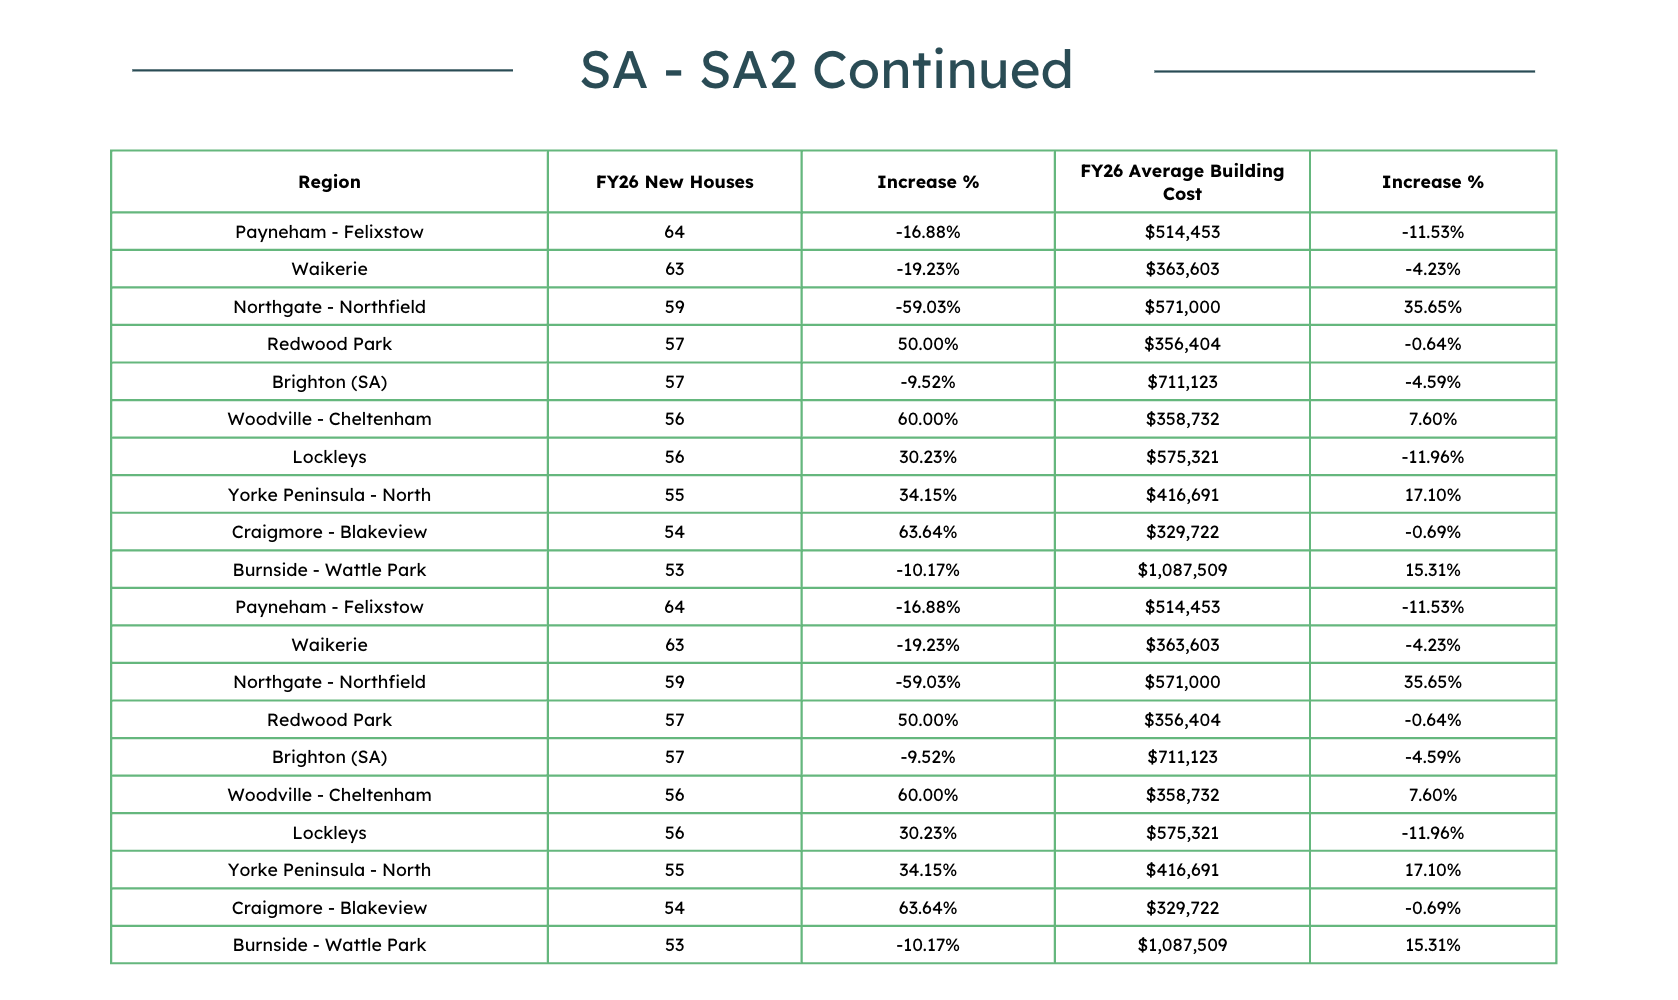
Average building costs varied considerably across South Australia during FY26, with some of Adelaide's established residential markets recording the highest values. Burnside – Wattle Park recorded the highest average building cost in the supplied data at $1,087,509 following a 15.31% increase. Brighton (SA) averaged $711,123 despite a 4.59% decline, while West Lakes rose by 19.06% to $695,477 and Glenelg (SA) recorded $639,523 following an 8.39% decline. Significant cost increases were recorded in St Agnes – Ridgehaven, up 45.74% to $462,708, Northgate – Northfield, up 35.65% to $571,000, McLaren Vale, up 22.57% to $409,906, and Mitchell Park, up 21.03% to $437,647. Conversely, notable declines occurred in Yankalilla (-19.21%), Lockleys (-11.96%), Payneham – Felixstow (-11.53%) and Glenelg (SA) (-8.39%).
Notable SA2 Regions:
Munno Para West – Angle Vale remained South Australia's largest contributor to new housing activity by a substantial margin, underlining the importance of Adelaide's northern growth corridor. Mount Barker continued to stand out as a major regional and peri-urban housing market with 503 new houses, while Virginia – Waterloo Corner, Gawler – North and Gawler – South highlighted continued activity across Adelaide's northern fringe. Seaford – Seaford Meadows recorded particularly strong growth in the south, increasing by 147.27% to 136 new houses. At the higher end of the market, Burnside – Wattle Park, Brighton (SA), West Lakes and Glenelg (SA) recorded some of the highest average building costs, reflecting the premium associated with construction in established metropolitan and coastal locations.
High-Increase Areas:
The most dramatic increases in new houses occurred across a mixture of metropolitan markets, with several areas recording substantial percentage growth from comparatively low previous-year bases. Woodcroft recorded the largest increase in the supplied data, surging by 1,240.00% to 67 new houses. Seaford – Seaford Meadows increased by 147.27% to 136, Gawler – South rose by 115.38% to 252, and Smithfield – Elizabeth North climbed by 105.26% to 117. Salisbury doubled with a 100.00% increase to 110 new houses, while Glenelg (SA) rose by 91.23% to 109 and Parafield Gardens increased by 86.36% to 82. Elizabeth East also recorded an 85.42% rise to 89, while Ingle Farm increased by 80.52% to 139. These results highlight expanding activity across Adelaide's northern and southern suburbs, although the largest percentage increases should be considered alongside the relatively modest absolute volumes in some locations.
Areas with Notable Cost Increases:
Several South Australian SA2 regions recorded substantial increases in average building costs during FY26. St Agnes – Ridgehaven experienced the largest increase in the supplied data, rising by 45.74% to $462,708, while Northgate – Northfield increased by 35.65% to $571,000. McLaren Vale rose by 22.57% to $409,906, Mitchell Park increased by 21.03% to $437,647, and Morphettville climbed by 20.92% to $489,671. Moonta also recorded a 20.14% increase to $468,723, while West Lakes rose by 19.06% to $695,477 and Nuriootpa increased by 18.46% to $437,507. Flinders Park climbed by 17.59% to $524,209, Enfield – Blair Athol rose by 17.47% to $428,541, and Smithfield – Elizabeth North increased by 17.42% to $306,436. These results show building cost pressures extending across established Adelaide suburbs, northern growth areas and regional and lifestyle markets.
In South Australia during FY26, new housing activity remained heavily concentrated in Adelaide's northern growth corridor, with Munno Para West – Angle Vale recording 1,205 new houses despite a 7.52% decline. Mount Barker increased by 7.48% to 503, while Gawler – South surged by 115.38% to 252 and Seaford – Seaford Meadows rose by 147.27% to 136. Other areas, including Smithfield – Elizabeth North, Salisbury and Ingle Farm, also recorded strong growth, while Northgate – Northfield, Lewiston – Two Wells and The Parks experienced substantial declines. Average building costs were highest in Burnside – Wattle Park at $1,087,509, followed by Brighton (SA) at $711,123 and West Lakes at $695,477. Strong cost increases in St Agnes – Ridgehaven, Northgate – Northfield and McLaren Vale further demonstrate changing construction costs across the state. Overall, the FY26 data indicates a South Australian housing market characterised by continued strength in key northern growth areas, emerging activity across selected southern and regional markets, and significant building cost increases in several established metropolitan locations.

This report delves into the housing data for Western Australia, focusing on Small Area 2 (SA2) regions. The data encompasses the number of new houses and the average building cost in each SA2 area.
Key Findings
New House Approvals:
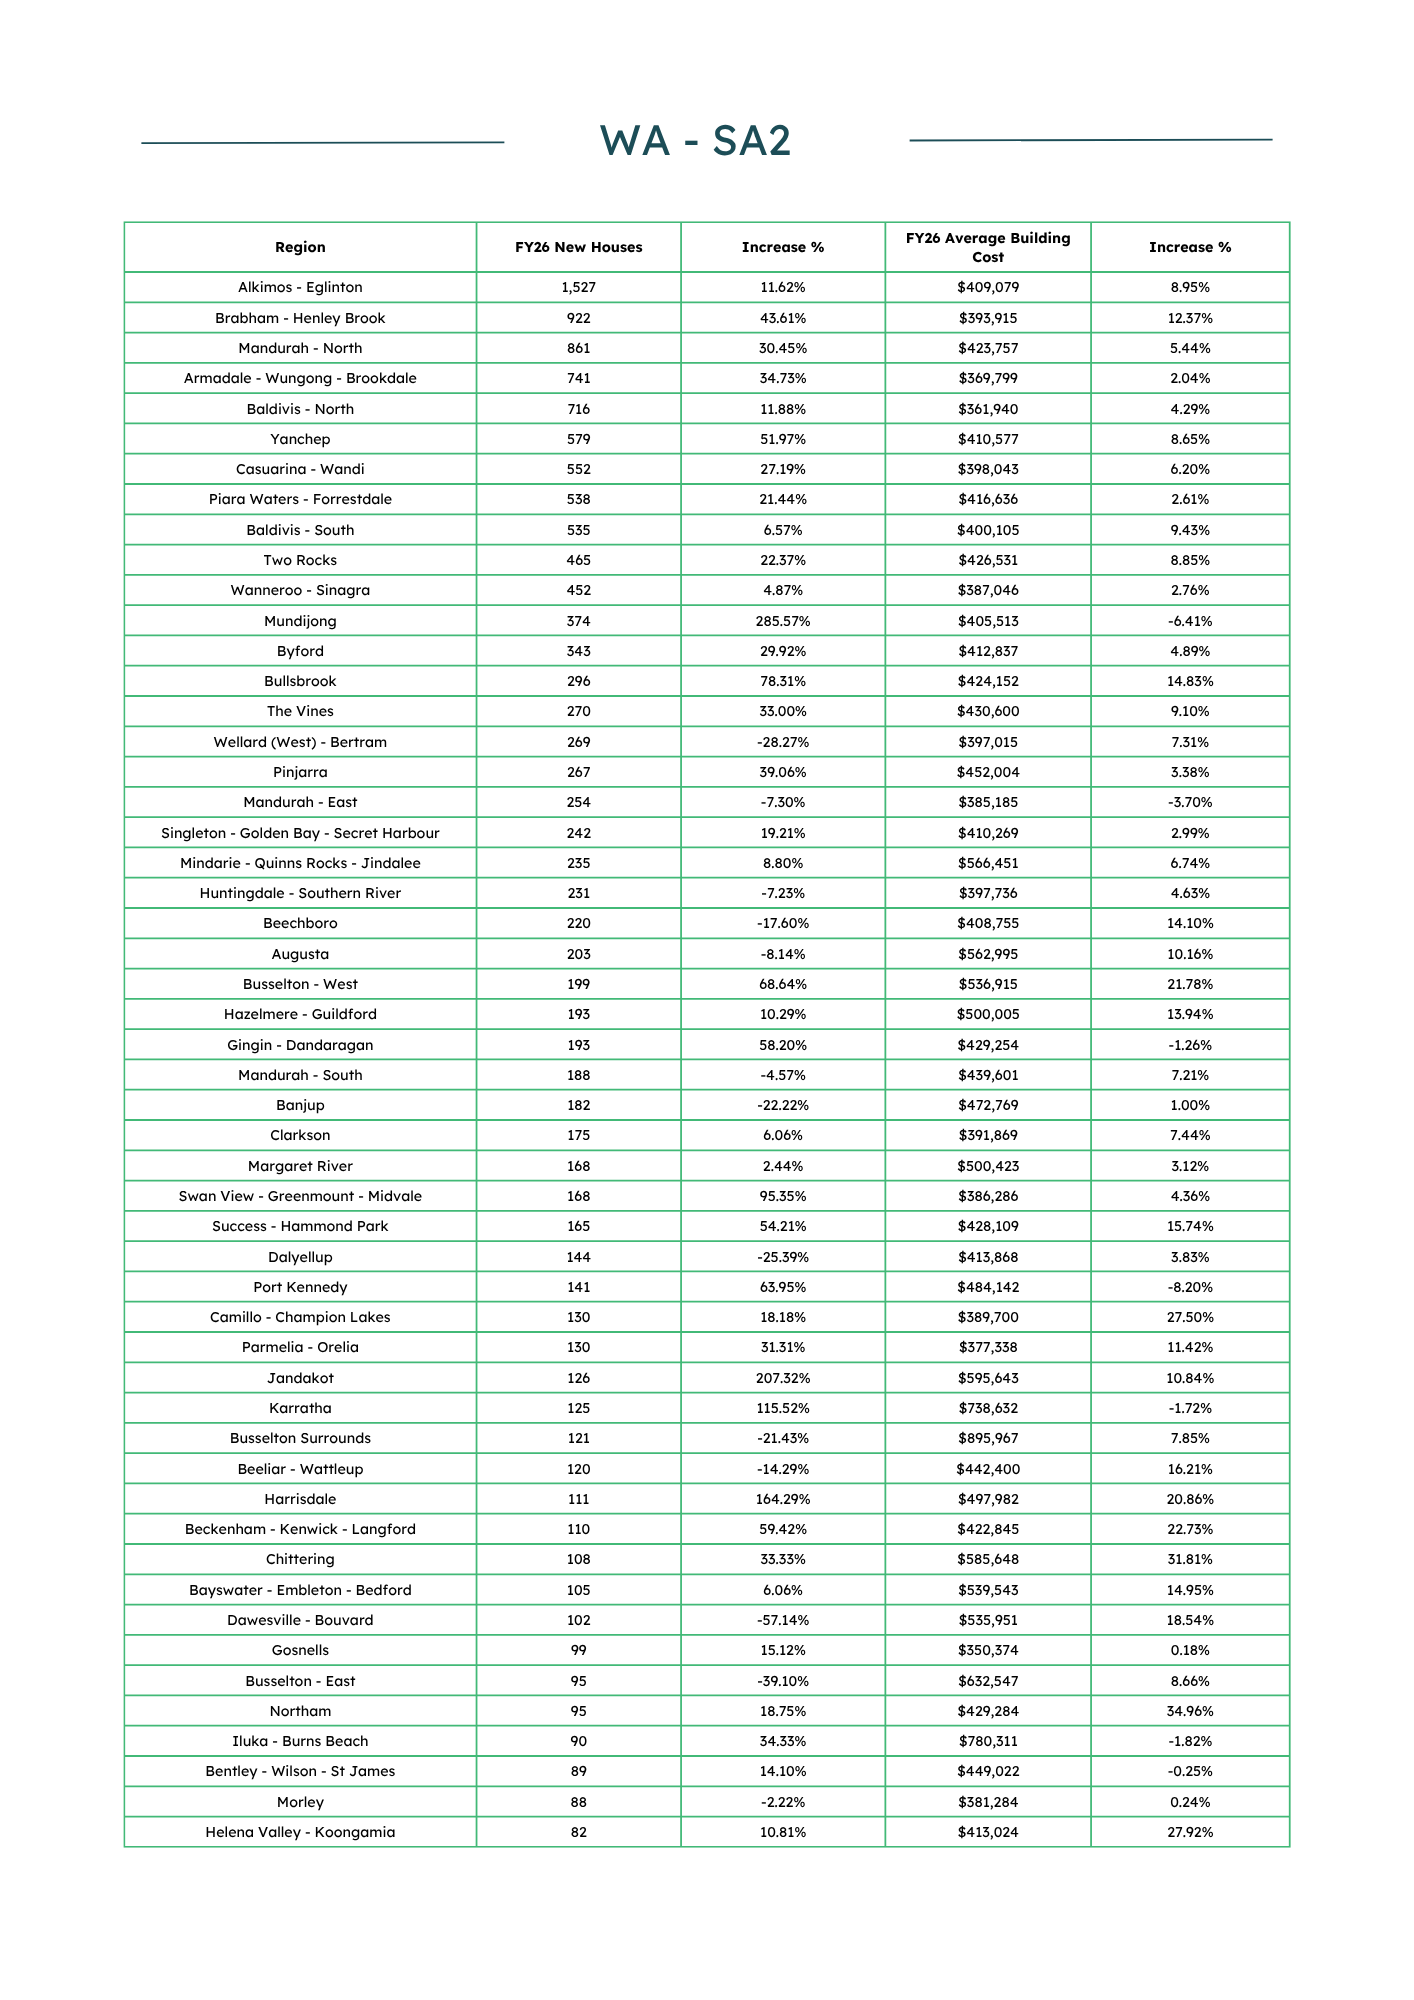
In Western Australia, new house activity showed broadly positive growth across many of the state's major development corridors in FY26. Alkimos – Eglinton recorded the highest volume with 1,527 new houses, increasing by 11.62%, while Brabham – Henley Brook rose by 43.61% to 922. Mandurah – North increased by 30.45% to 861, Armadale – Wungong – Brookdale grew by 34.73% to 741, and Baldivis – North rose by 11.88% to 716. Yanchep also recorded strong growth, increasing by 51.97% to 579 new houses, while Casuarina – Wandi rose by 27.19% to 552. Significant increases were recorded in Mundijong, up 285.57% to 374, Bullsbrook, up 78.31% to 296, and Busselton – West, up 68.64% to 199. In contrast, Australind – Leschenault declined by 68.97% to 63 new houses, Ellenbrook fell by 57.43% to 63, Dawesville – Bouvard declined by 57.14% to 102, and Busselton – East fell by 39.10% to 95.
Average Building Costs:
Average building costs varied considerably across Western Australia during FY26, with Perth's premium residential markets recording the highest values. Nedlands – Dalkeith – Crawley recorded the highest average building cost in the supplied data at $1,481,790 following an 18.32% increase. Applecross – Ardross rose by 31.58% to $1,272,618, while Booragoon averaged $1,156,263 after a 7.84% increase. Melville reached $905,323, up 18.63%, while Busselton Surrounds recorded $895,967, up 7.85%. Significant cost increases were also recorded in Hocking – Pearsall, up 37.65% to $423,642, Northam, up 34.96% to $429,284, Chittering, up 31.81% to $585,648, and Greenfields, up 30.76% to $397,667. Conversely, notable declines occurred in Bayonet Head – Lower King (-16.44%), Port Kennedy (-8.20%), Broome (-6.76%), Mundijong (-6.41%) and Karrinyup – Gwelup – Carine (-6.30%).
Notable SA2 Regions:
Alkimos – Eglinton remained Western Australia's largest contributor to new housing activity, reinforcing the importance of Perth's northern growth corridor, while Brabham – Henley Brook and Yanchep also recorded substantial volumes and strong growth. Mandurah – North and Baldivis – North highlighted continued housing activity south of Perth, while Armadale – Wungong – Brookdale and Casuarina – Wandi demonstrated the strength of the city's south-eastern development corridors. Mundijong stood out with a 285.57% increase to 374 new houses, while Busselton – West recorded a 68.64% rise to 199, highlighting growth beyond metropolitan Perth. At the higher end of the market, Nedlands – Dalkeith – Crawley, Applecross – Ardross and Booragoon recorded the state's highest average building costs in the supplied data.
High-Increase Areas:
The most dramatic increases in new houses occurred across a combination of emerging metropolitan and regional markets. Midland – Guildford recorded the largest percentage increase in the supplied data, rising by 485.71% to 82 new houses, while Mundijong surged by 285.57% to 374. Jandakot increased by 207.32% to 126 new houses, Harrisdale rose by 164.29% to 111, and Karratha increased by 115.52% to 125. Swan View – Greenmount – Midvale climbed by 95.35% to 168, Girrawheen rose by 80.00% to 54, Bayonet Head – Lower King increased by 79.31% to 52, and Bullsbrook grew by 78.31% to 296. These results highlight expanding housing activity across Perth's developing corridors and selected regional centres, although some of the largest percentage increases reflect growth from comparatively low previous-year bases.
Areas with Notable Cost Increases:
Several Western Australian SA2 regions recorded substantial increases in average building costs during FY26. Hocking – Pearsall experienced the largest rise in the supplied data, increasing by 37.65% to $423,642, while Northam rose by 34.96% to $429,284. Chittering increased by 31.81% to $585,648, Applecross – Ardross rose by 31.58% to $1,272,618, and Greenfields climbed by 30.76% to $397,667. Cannington – Queens Park also recorded a 28.87% increase to $468,400, while Helena Valley – Koongamia rose by 27.92% to $413,024 and Camillo – Champion Lakes increased by 27.50% to $389,700. Middle Swan – Herne Hill rose by 26.97% to $465,785, and Geraldton – North increased by 25.26% to $515,164. These results show building cost pressures extending across premium inner-metropolitan areas, Perth's middle and outer suburbs, and regional Western Australia.
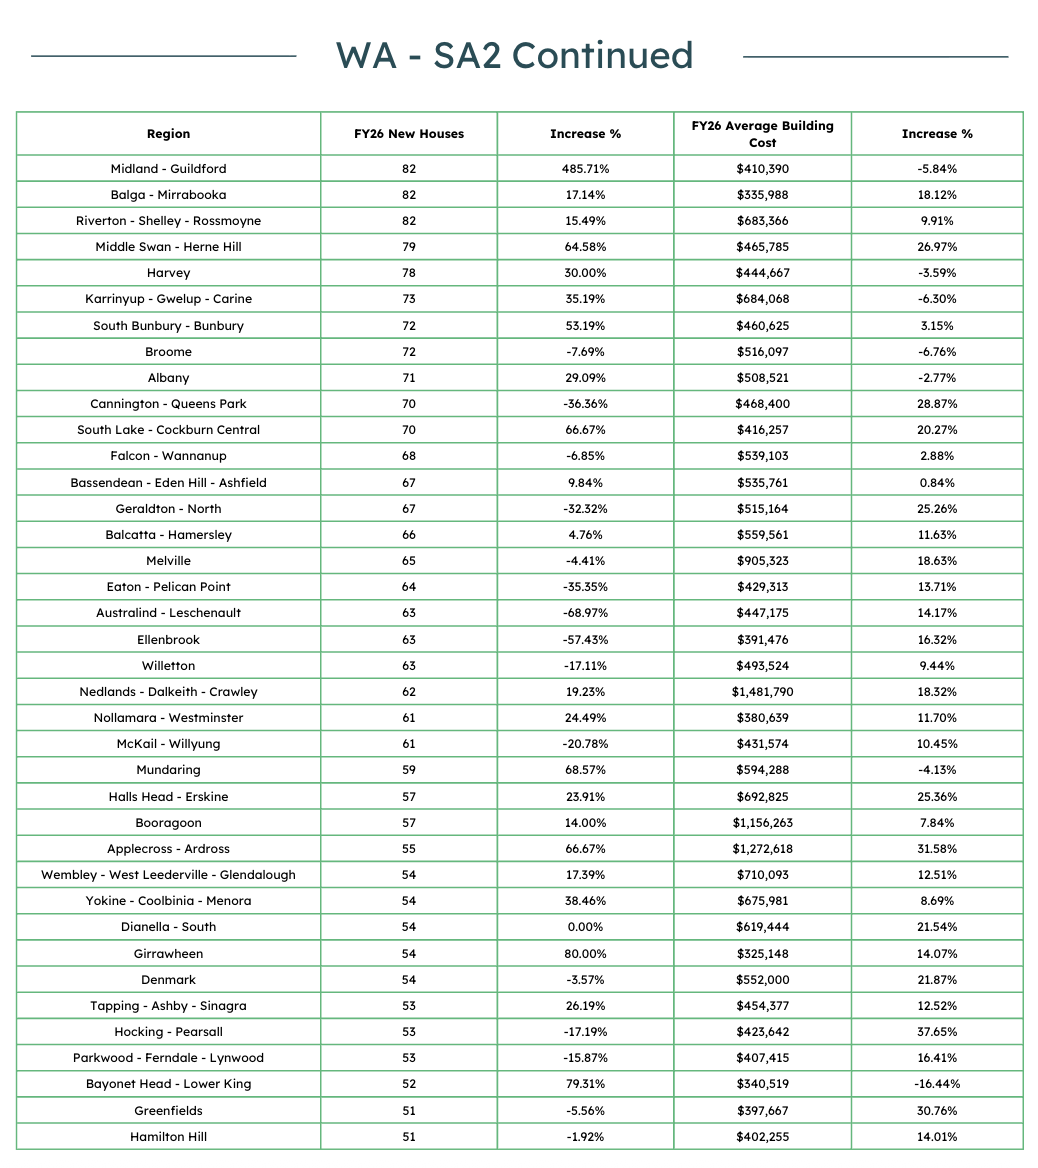
In Western Australia during FY26, new housing activity remained concentrated across Perth's major northern, southern and south-eastern growth corridors, with Alkimos – Eglinton leading the state at 1,527 new houses after an 11.62% increase. Brabham – Henley Brook rose by 43.61% to 922, Mandurah – North increased by 30.45% to 861, and Armadale – Wungong – Brookdale grew by 34.73% to 741. Emerging markets also recorded substantial increases, led by Midland – Guildford, Mundijong and Jandakot, while declines were evident in Australind – Leschenault, Ellenbrook and Dawesville – Bouvard. Average building costs remained highest in premium Perth locations, with Nedlands – Dalkeith – Crawley reaching $1,481,790, Applecross – Ardross $1,272,618 and Booragoon $1,156,263. Strong cost increases in Hocking – Pearsall, Northam, Chittering and Applecross – Ardross further demonstrate the changing cost environment. Overall, the FY26 data indicates a Western Australian housing market characterised by sustained activity across major growth corridors, rapid expansion in selected emerging areas and increasing building costs across both metropolitan and regional markets.

This report delves into the housing data for the Australian Capital Territory, focusing on Small Area 2 (SA2) regions. The data encompasses the number of new houses and the average building cost in each SA2 area.
Key Findings
New House Approvals:
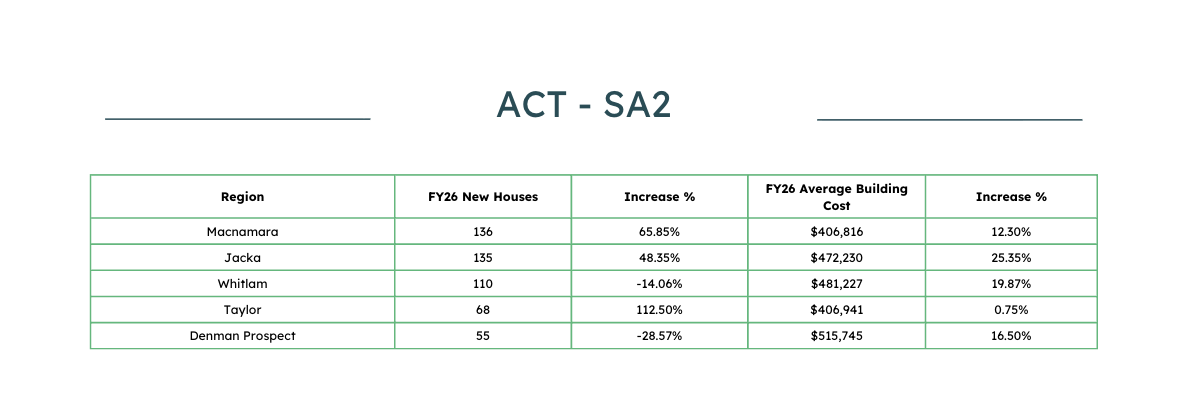
In the Australian Capital Territory, new house activity showed mixed results across SA2 regions in FY26, with strong growth concentrated in several emerging residential areas. Macnamara recorded the highest volume with 136 new houses, increasing by 65.85%, while Jacka followed closely with 135 after a 48.35% rise. Whitlam recorded 110 new houses despite a 14.06% decline. Taylor experienced the strongest percentage growth, increasing by 112.50% to 68 new houses, while Denman Prospect declined by 28.57% to 55. These results indicate that new housing activity was primarily concentrated in Canberra's developing residential areas, although performance varied considerably between individual SA2 regions.
Average Building Costs:
Average building costs increased across all five ACT SA2 regions included in the supplied data during FY26. Denman Prospect recorded the highest average building cost at $515,745 following a 16.50% increase, while Whitlam rose by 19.87% to $481,227. Jacka recorded an average building cost of $472,230 after experiencing the largest percentage increase of 25.35%. Macnamara increased by 12.30% to $406,816, while Taylor recorded the smallest movement, rising by 0.75% to $406,941. The broad-based increases indicate upward building cost movements across both higher-value and emerging residential areas.
Notable SA2 Regions:
Macnamara and Jacka emerged as the largest contributors to new housing activity in the supplied ACT data, recording 136 and 135 new houses respectively. Both also experienced substantial growth, with Macnamara increasing by 65.85% and Jacka by 48.35%. Taylor stood out for the strongest growth rate, rising by 112.50%, while Whitlam remained a significant contributor despite its 14.06% decline. At the higher end of the market, Denman Prospect recorded the highest average building cost at $515,745, followed by Whitlam at $481,227 and Jacka at $472,230.
High-Increase Areas:
Taylor recorded the most significant increase in new houses during FY26, rising by 112.50% to 68. Macnamara followed with a 65.85% increase to 136 new houses, while Jacka rose by 48.35% to 135. In contrast, Whitlam declined by 14.06% to 110 new houses and Denman Prospect fell by 28.57% to 55. These results highlight continued expansion across selected developing Canberra suburbs, particularly Taylor, Macnamara and Jacka.
Areas with Notable Cost Increases:
Building costs increased across every ACT SA2 region included in the supplied data. Jacka recorded the largest increase, rising by 25.35% to an average of $472,230, while Whitlam increased by 19.87% to $481,227. Denman Prospect rose by 16.50% to $515,745, maintaining the highest average building cost among the areas shown. Macnamara increased by 12.30% to $406,816, while Taylor remained comparatively stable with a 0.75% rise to $406,941. These results demonstrate broadly rising construction costs across the ACT, despite differing levels of new housing activity.